Case study: Visualising Mill Road
Objective:
Explore if and how simple voting technology and visualisations, distributed throughout a community, can encourage local participation and other types of engagement
Setting:
Community groups in a neighbourhood in Cambridge (UK) were keen to participate in a project that would encourage local residents to think about their perceptions of the area, and to consider the perceptions held by others in the community
Process:
Interviews, ethnography, sketching, prototyping, usability evaluation, observations, qualitative analysis, quantitative analysis
Approach:
1. I conducted a series of interview with members of the community groups, local business owners, local residents, and the local council, to learn more about the area.
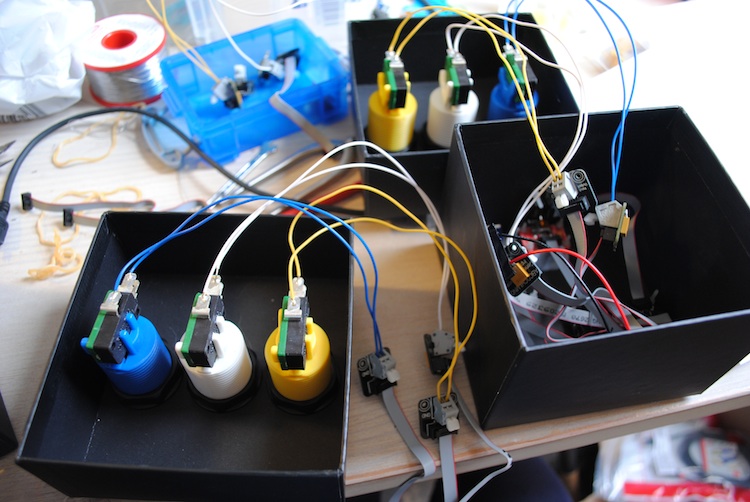
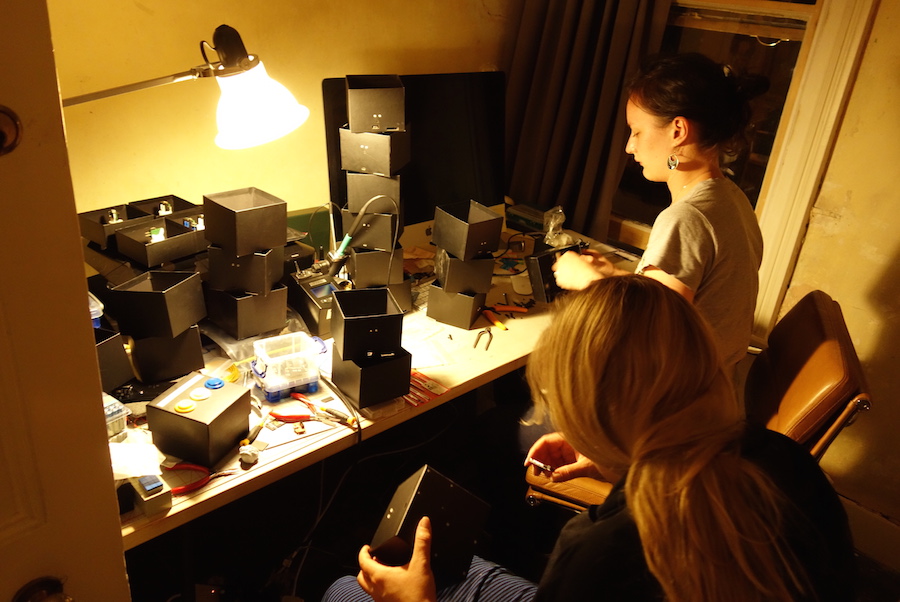
2. I developed sketches and prototypes of possible input technologies and visualisation options, which I then discussed and developed further in collaboration with the community groups.
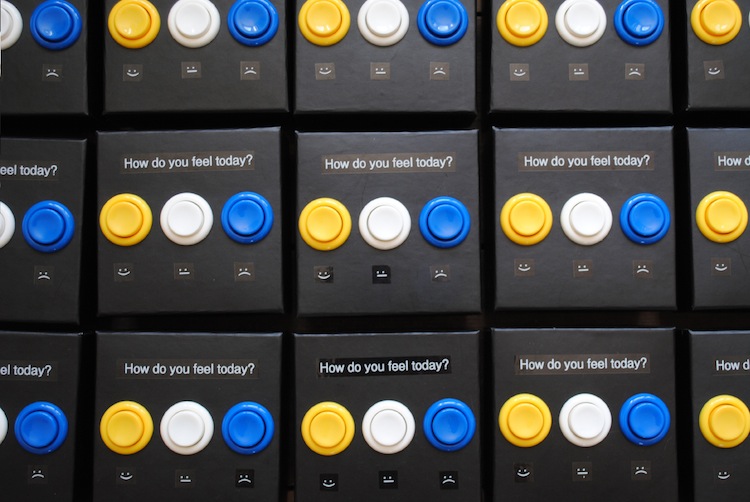
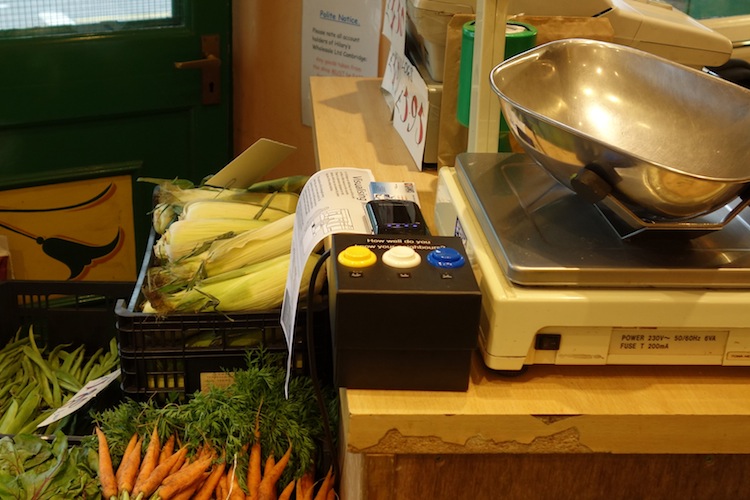
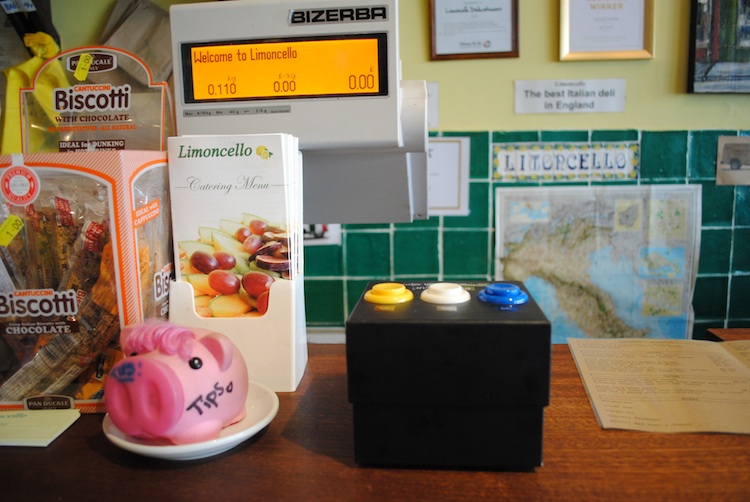
3. We built 18 voting devices, collected question ideas from local residents, and deployed the devices in 18 different shops.
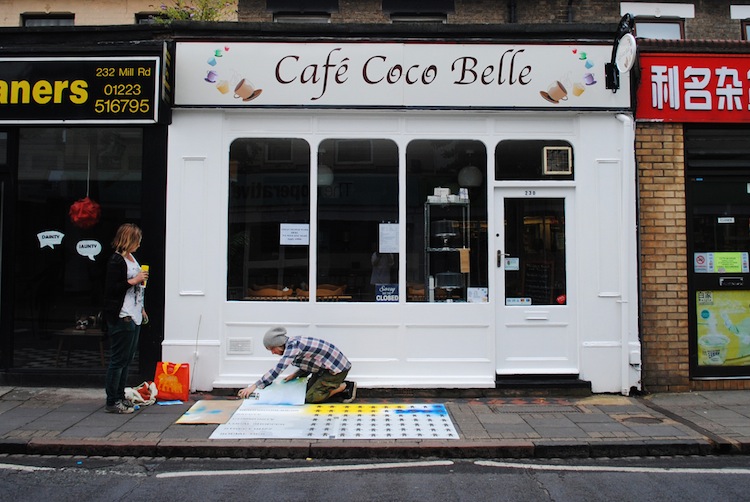
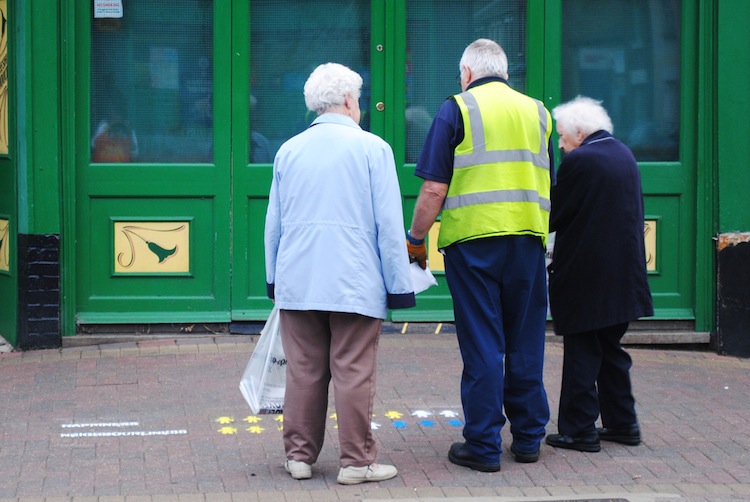
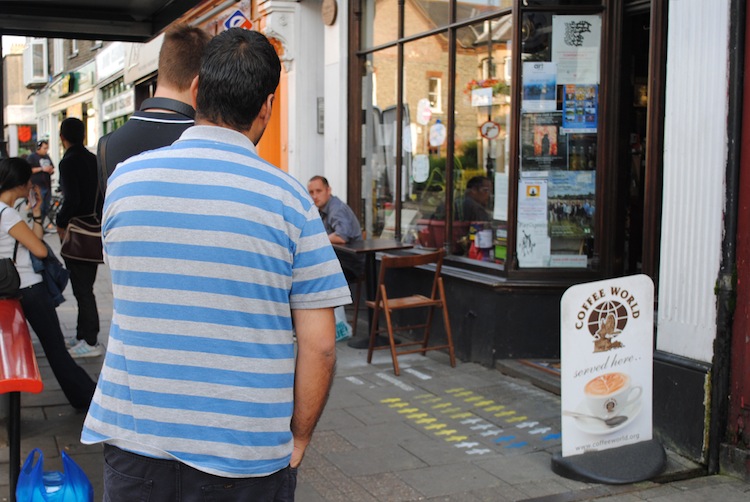
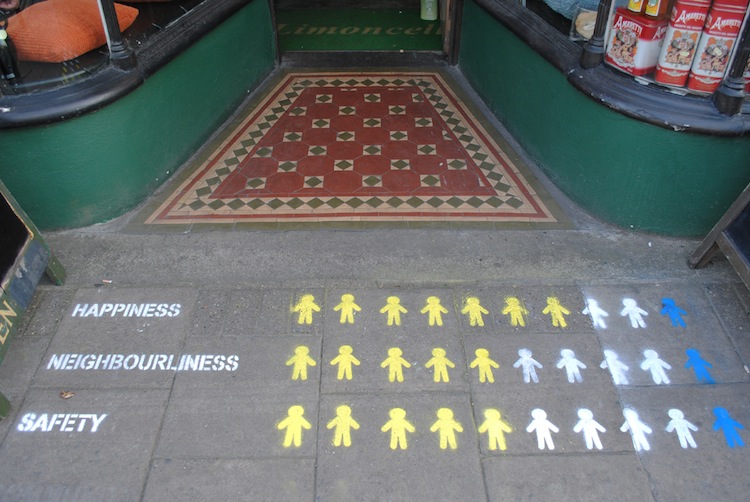
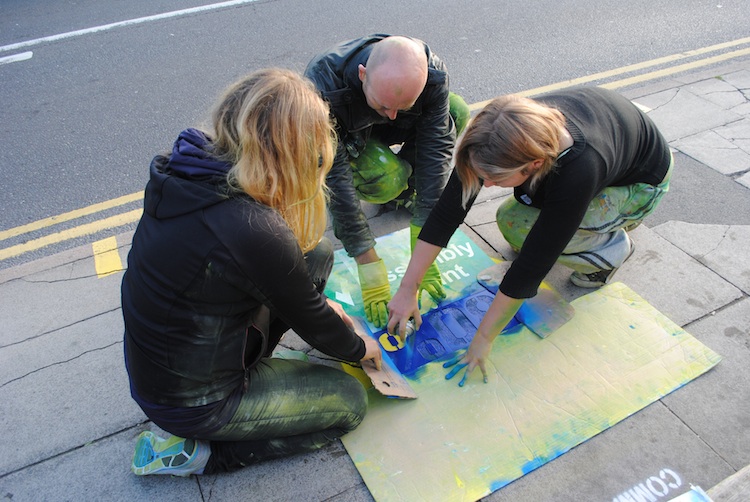
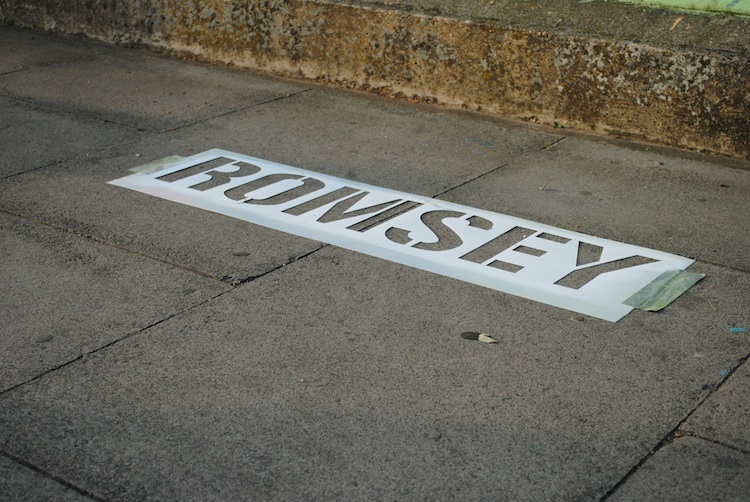
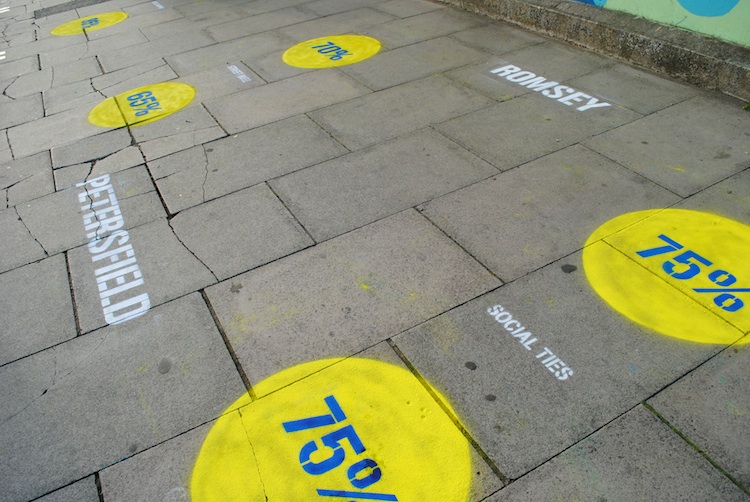
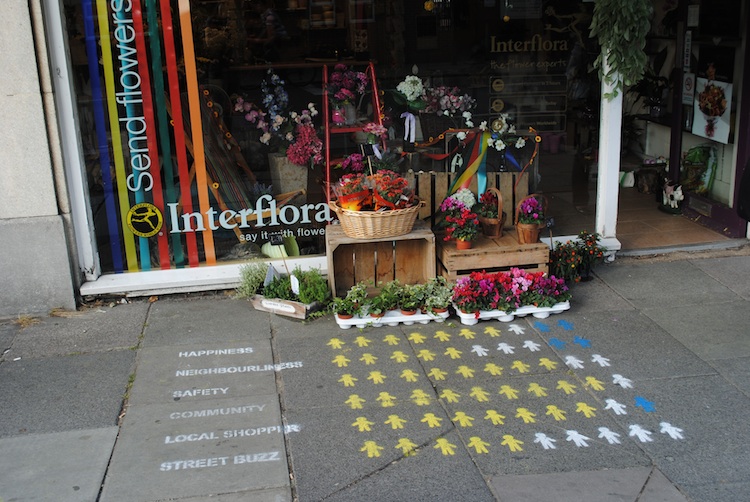
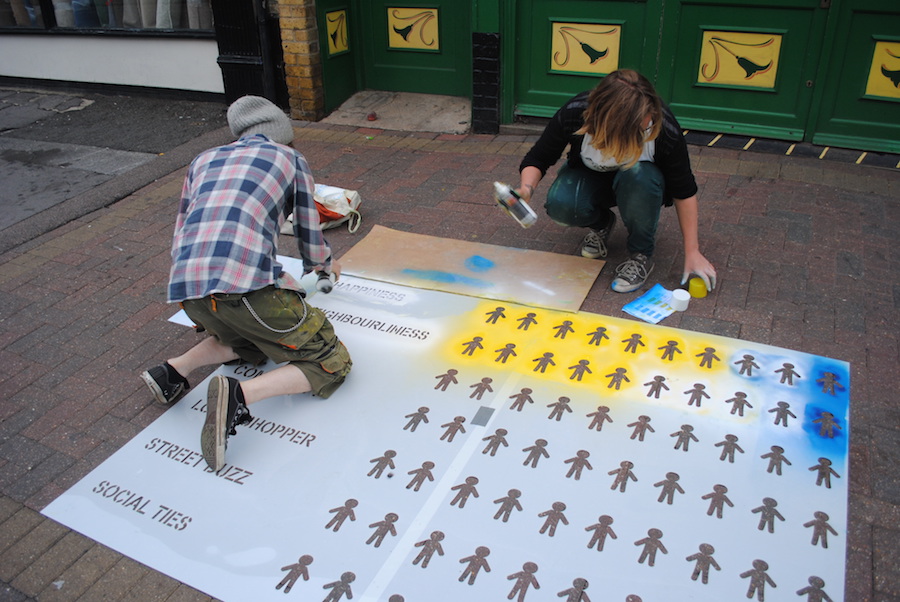
4. Over a 3-week period, we changed the questions every other day, and displayed the latest data on the pavement of all participating shops, using chalk graffiti.
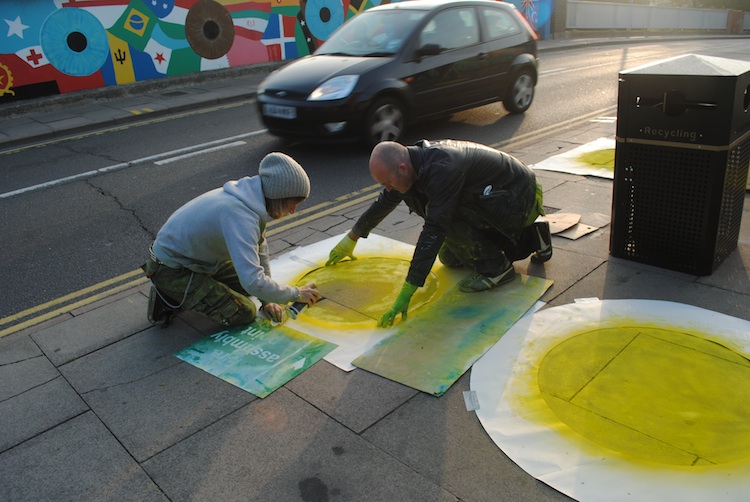
5. At the end of the study, a final visualisation was sprayed in a central area, summarising the answers given to each of the posed questions
6. During the deployment, I conducted observations interviews with shopkeepers and passers-by, and collected the log data from all devices.

Findings
During the deployment a total of 11,610 votes were cast. Analysis of the observational data, interviews, and log data revealed that the combination of situated input technology and situated visualisations successfully engaged local residents in a number of ways, by evoking curiosity, sparking discourse on local topics, enabling comparison between questions, shops, and areas, and encouraging people to reflect on locally held views. Several specific design elements were found to contribute to this:
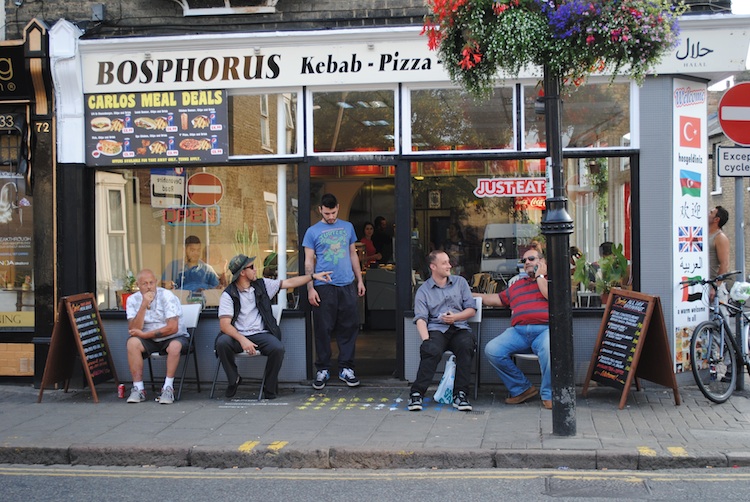
By placing the voting devices inside the local shops, the project was embedded in the existing community practices
The involvement of local and familiar shopkeepers supported the development of trust in the project, as the shopkeepers could act as champions
By deploying the voting devices in a variety of shops, the project managed to reach a diverse audience, with people from a wide range of backgrounds and ages
The use of an alternative display surface, the pavement, prevented display blindness and drew a high level of attention to the visualisations throughout the de- ployment
The transient nature of the visualisations helped set the expectations of the community, shopkeepers and local council about the duration of the project, thereby motivating short-term engagement
By updating the visualisations every other day, anticipation was created. Over time, people started understanding the rhythm of the updating process, and adjusted their behaviour accordingly, visiting the voting devices and visualisations on those days to see the latest changes
Team
This project was carried out in collaboration with Dr Vaiva Kalnikaite and Professor Yvonne Rogers, and was funded by ICRI Cities.
For more information, see: www.visualisingmillroad.com
Media articles
MetaTrend: '지역 공동체의 미디어가 되는 보도블럭', May 2014 (PDF)
Fast Company: 'How These Simple Chalk Infographics On The Sidewalk Created A Neighborhood', 25 March 2014 (link)
Experimenta Magazine: 'Visualising Mill Road, ICRI Cities', 17 March 2014 (link)
Infosthetics: 'Visualising Mill Road: Informing Communities by Infographics in the Street', 27 February 2014 (link)
Mill Road Bridges Newsletter: 'Mill Road data project intrigues BBC News', November 2013 (PDF)
Cambridge Edition: 'Visualising Mill Road', October 2013 (PDF)
Cambridge News: 'High-tech study asks whether divide between two halves of Mill Road in Cambridge real or imagined', 31 August 2013 (link / PDF)
BBC News: 'Cambridge Mill Road chalk graffiti charts scientists' community data', 30 August 2013 (link)
Radio interview on BBC Radio Cambridge's 'The Paul Stainton Bigger Breakfast Show', 30 August 2013
Radio interview on Cambridge 105's '105 Drive with Julian Clover', 28 August 2013 (link)
Publications
Lisa Koeman, Vaiva Kalnikaite, and Yvonne Rogers. (2015). "Everyone Is Talking about It!": A Distributed Approach to Urban Voting Technology and Visualisations. Proceedings of the ACM Conference on Human Factors in Computing Systems (CHI '15). [PDF][BibTeX] (Honorable Mention Award, top 5%)
Lisa Koeman. An Exploratory Study into the Public and Situated Visualisation of Local Data in Urban Communities. DIS Doctoral Consortium 2014: Proceedings of the 2014 ACM Conference on Designing Interactive Systems (DIS ’14). [PDF][BibTeX]
Lisa Koeman, Vaiva Kalnikaite, Yvonne Rogers, and Jon Bird. What Chalk and Tape Can Tell Us: Lessons Learnt for Next Generation Urban Displays. International Symposium on Pervasive Displays (PerDis’14). [PDF][BibTeX]
Photos