While the number of participants is only one of many factors in producing a good study, I thought it would be interesting to see how many participants are typically involved in UX/HCI research. So I had a look at all the papers published at CHI2018, the largest – and arguably most prestigious – Human-Computer Interaction conference in the world.
A few basics:
- 666 papers were accepted for publication at CHI2018
- Of those, 519 papers describe one or more studies that involved participants
- Because quite a few papers describe multiple studies there are a total of 678 studies involving participants
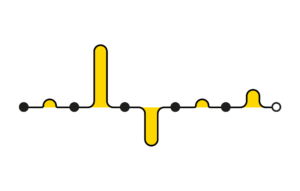
Let’s have a look at them and see how many participants were recruited in each of these studies:
As you can see the spread is huge: from a study with 1 participant to a study with 168960 (!).
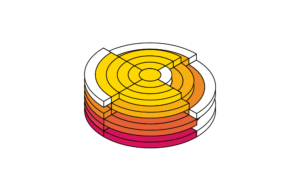
Next, let’s roughly classify the studies by research methodologies. Considering the data per methodology will be more meaningful, as you would naturally expect certain methodologies to involve larger numbers of participants than others (for example because participants will be easier to recruit, or because the methodology focuses more on quantitative rather than qualitative measures).
Now let’s (temporarily) remove outliers. There are a few impressively enormous studies, but they heavily skew the data. By ignoring studies that fall outside of the upper and lower boundaries (respectively Q3 + (interquartile range * 1.5) and Q1 – (interquartile range * 1.5), calculated per methodology) – a total of 69 studies – we can more clearly see the spread per methodology:
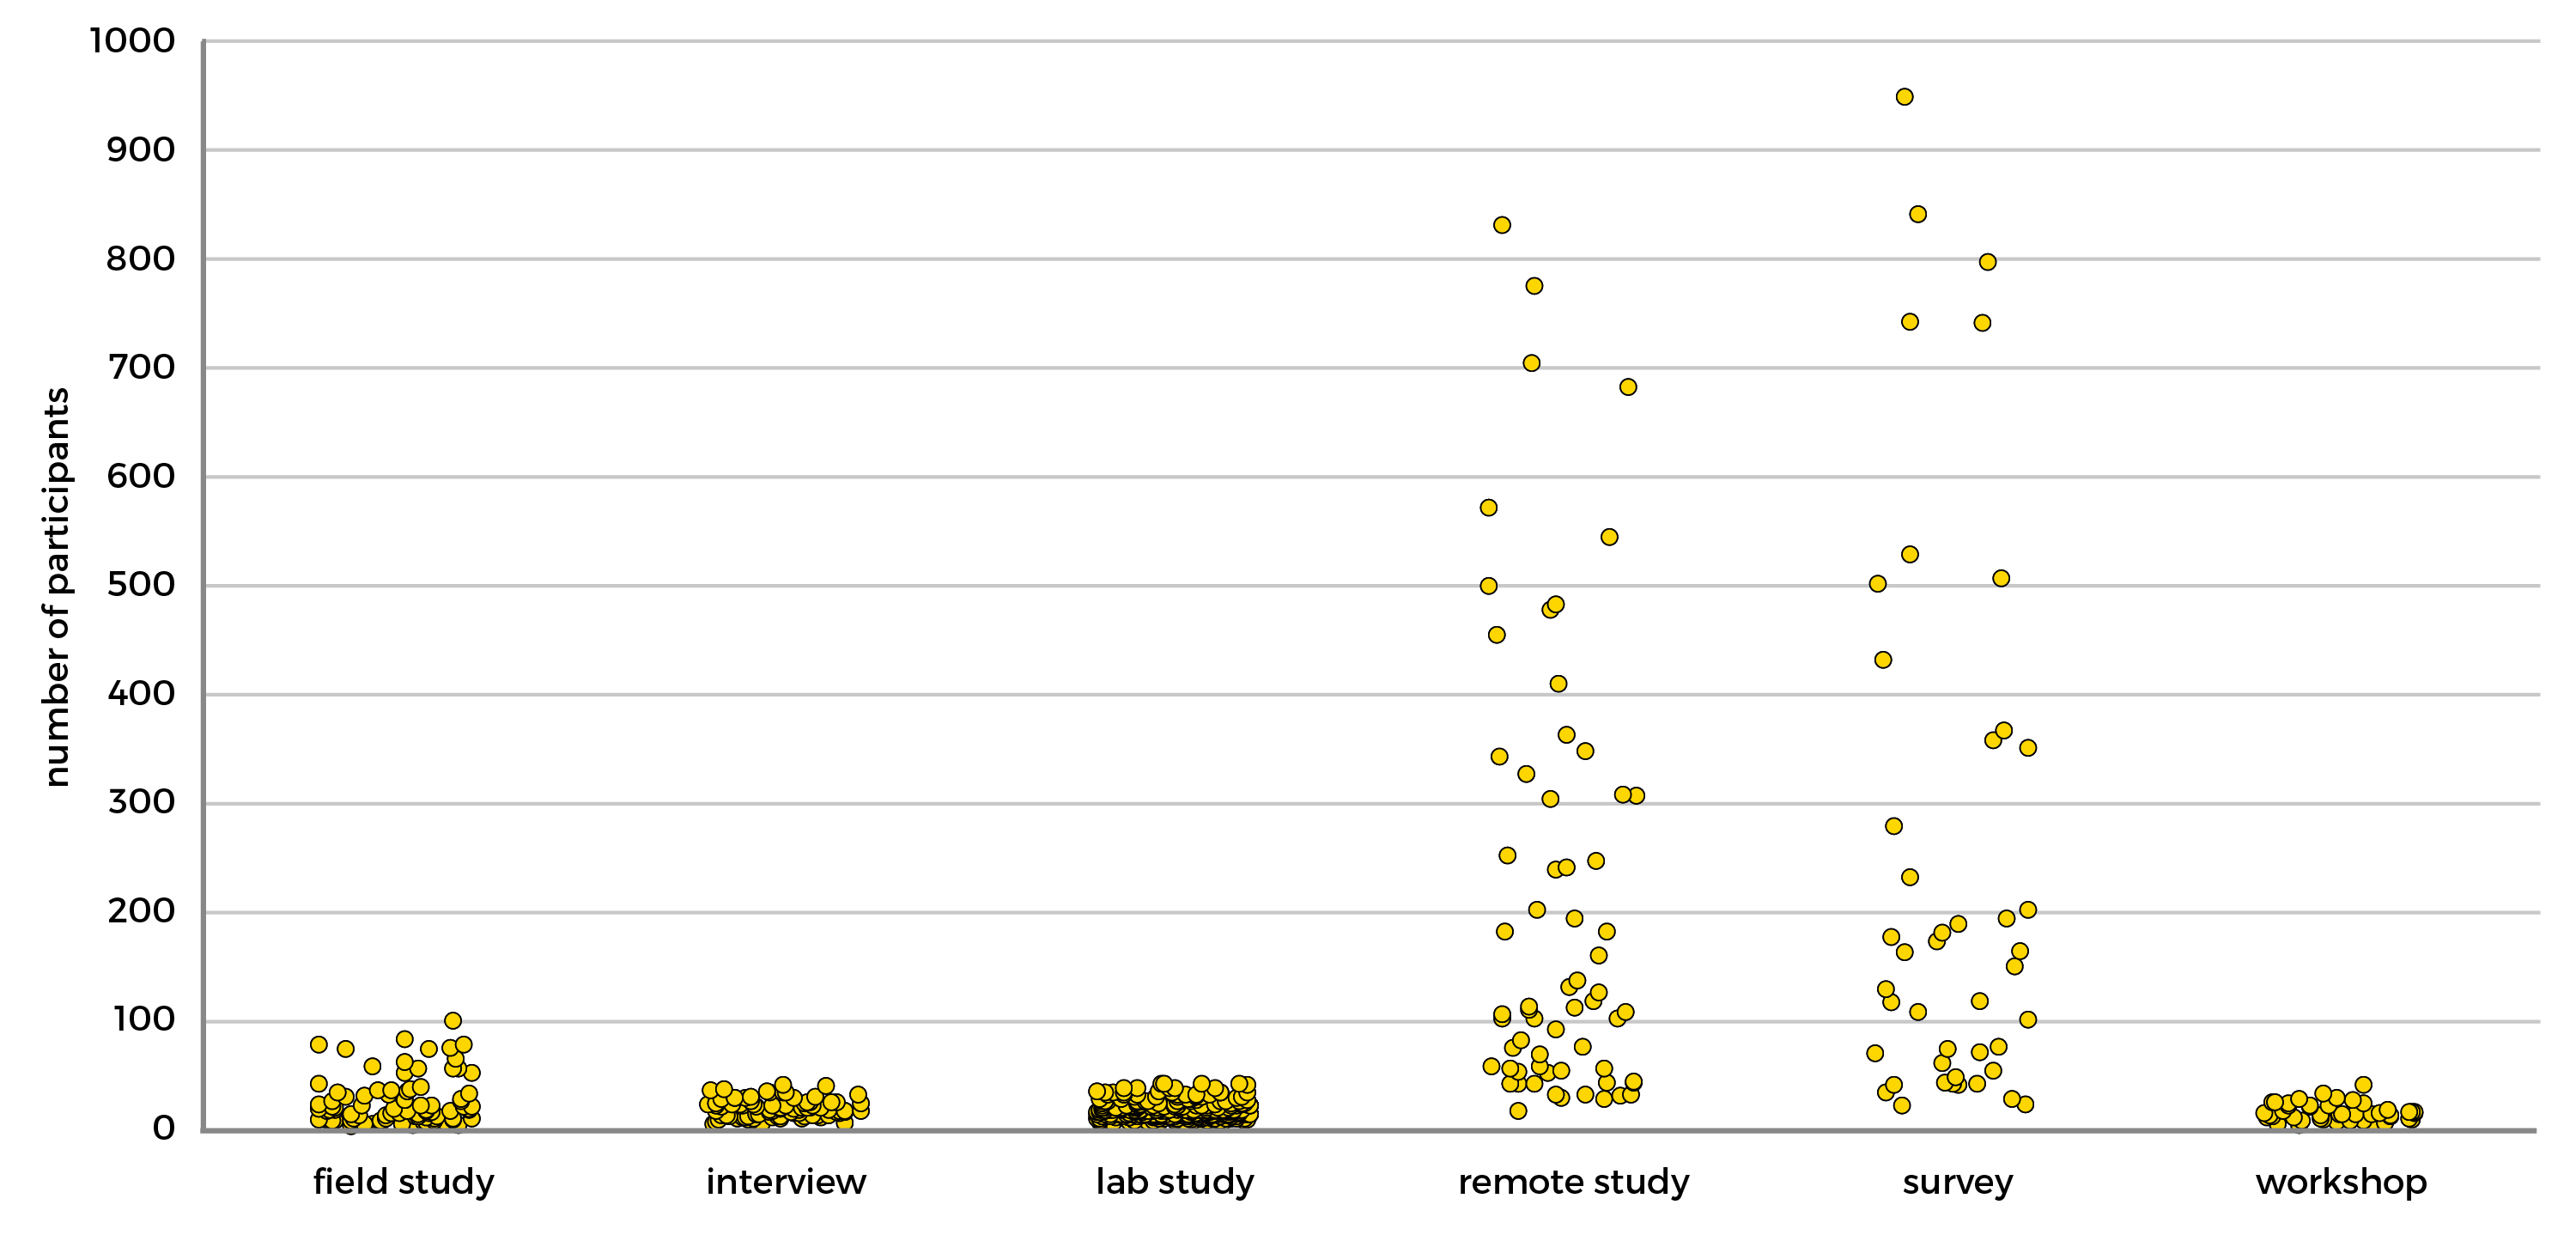
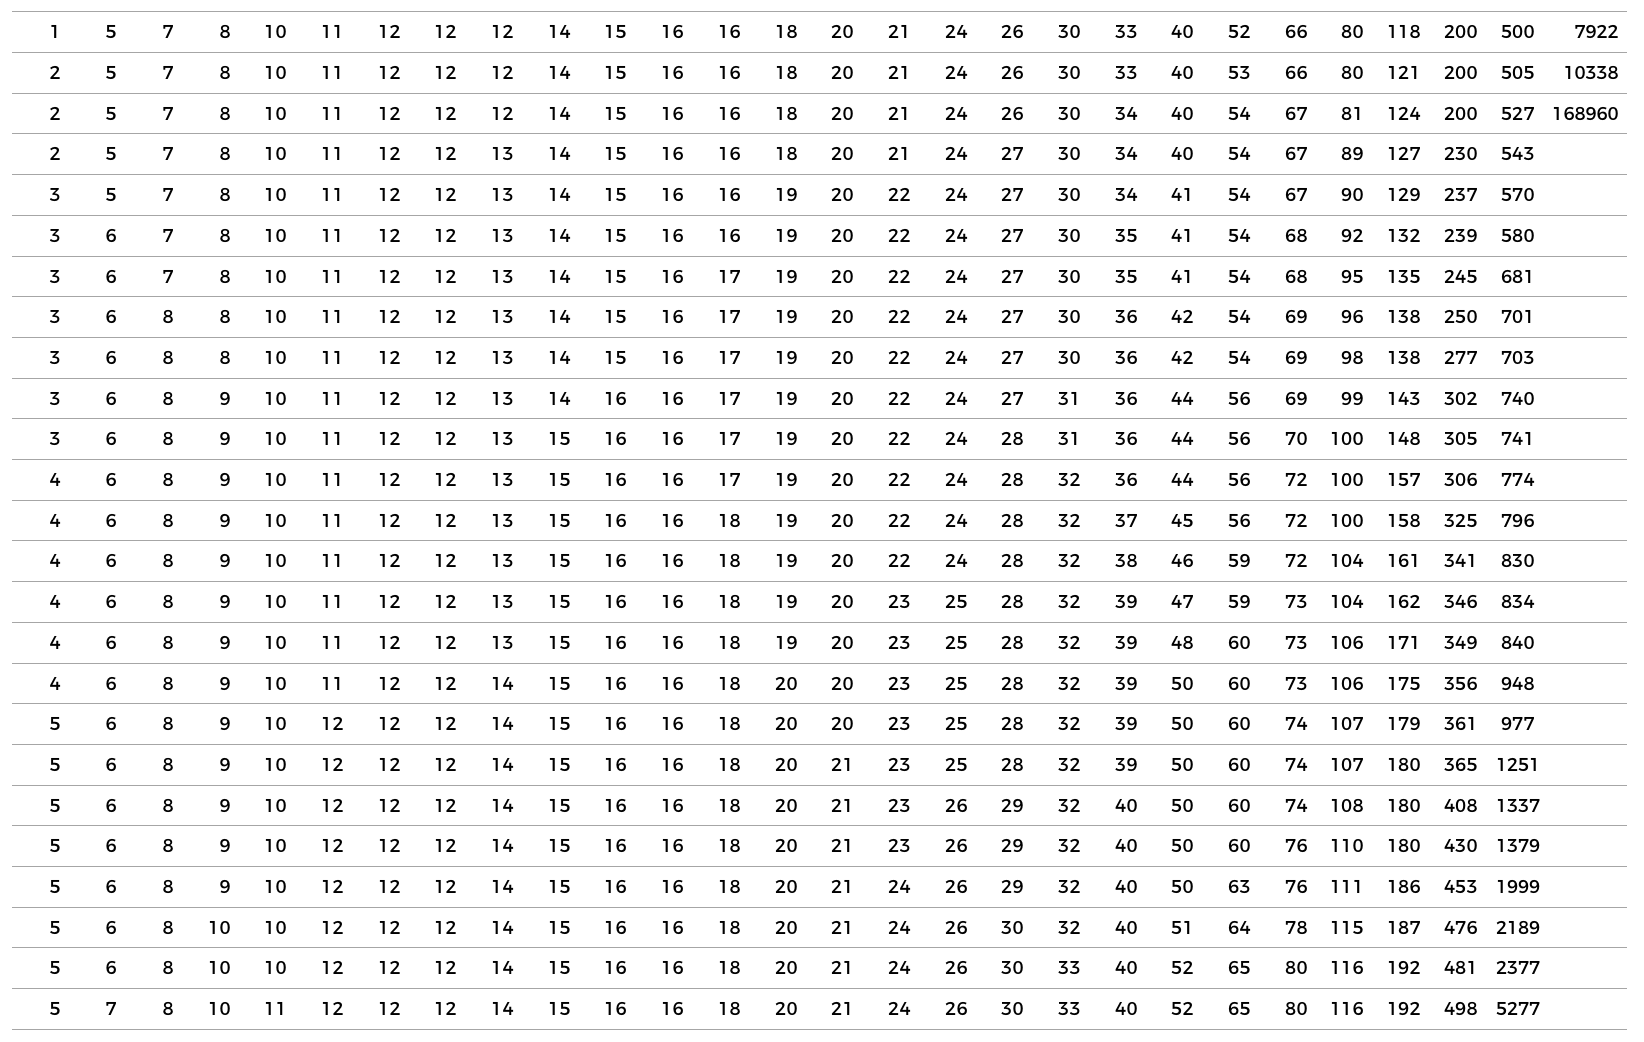
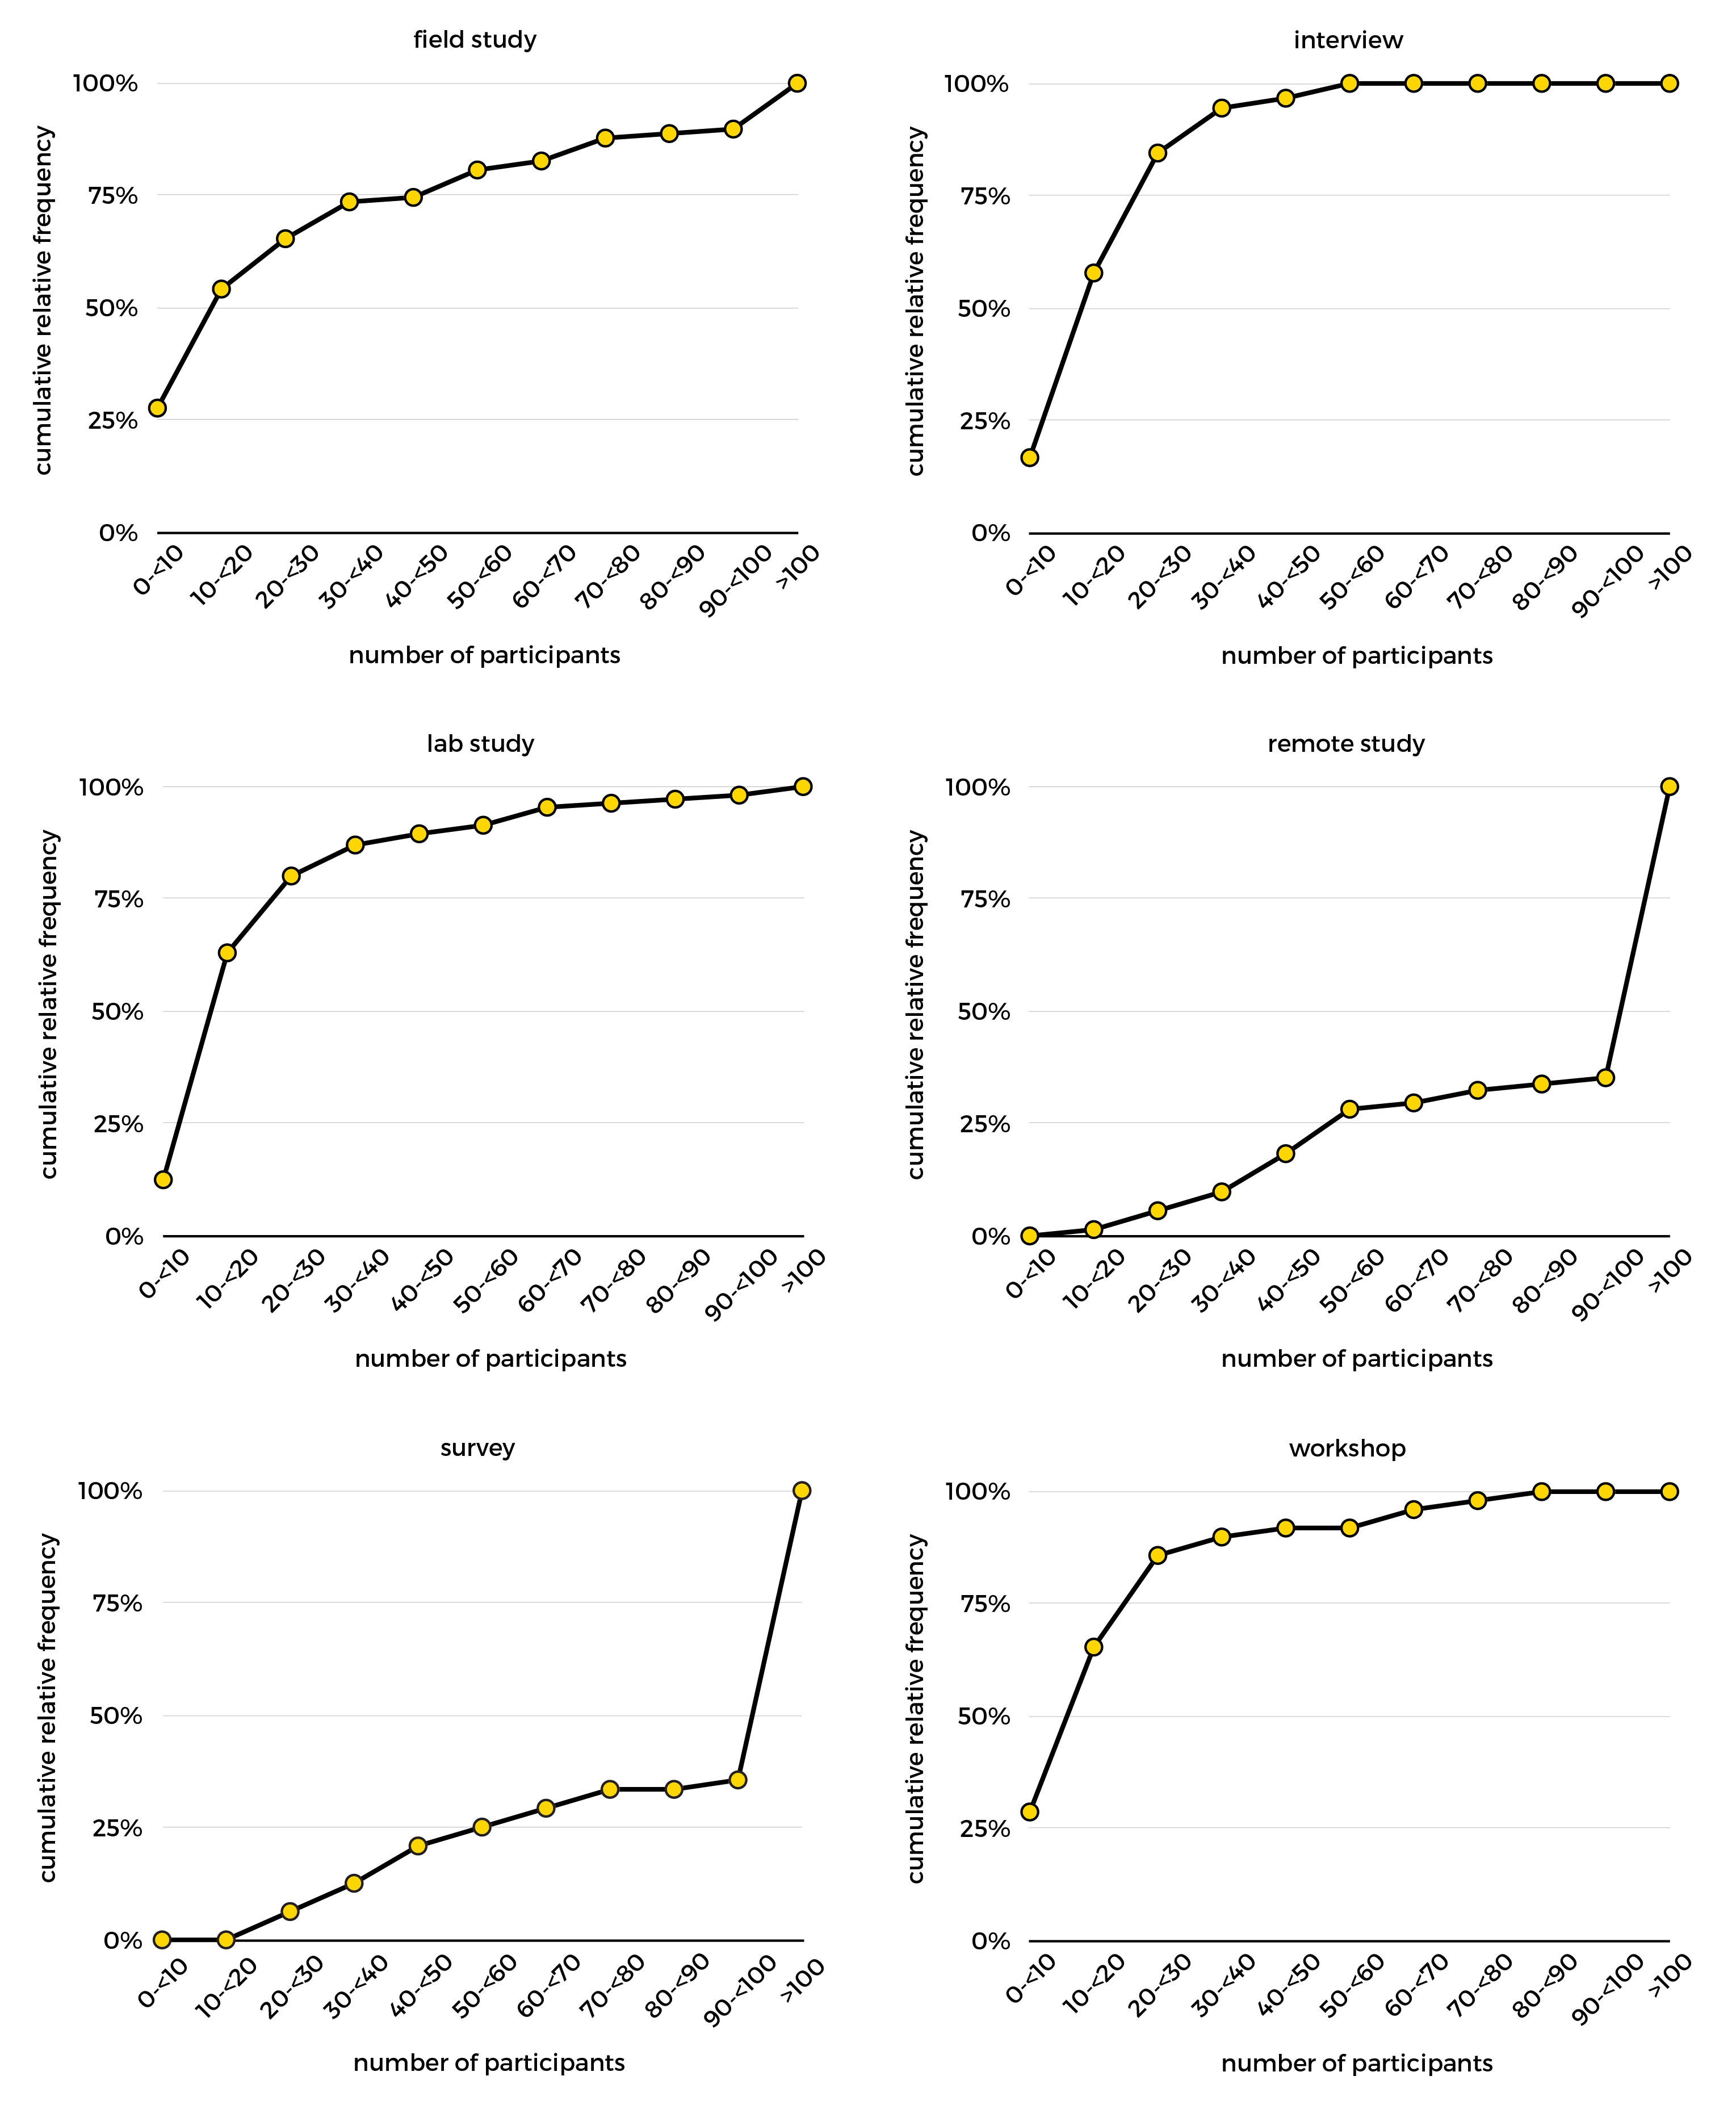
This shows that remote studies and surveys have the largest spread, while the other methodologies typically use far fewer participants. Let’s put the outliers back in and have a final look at the cumulative relative frequencies:
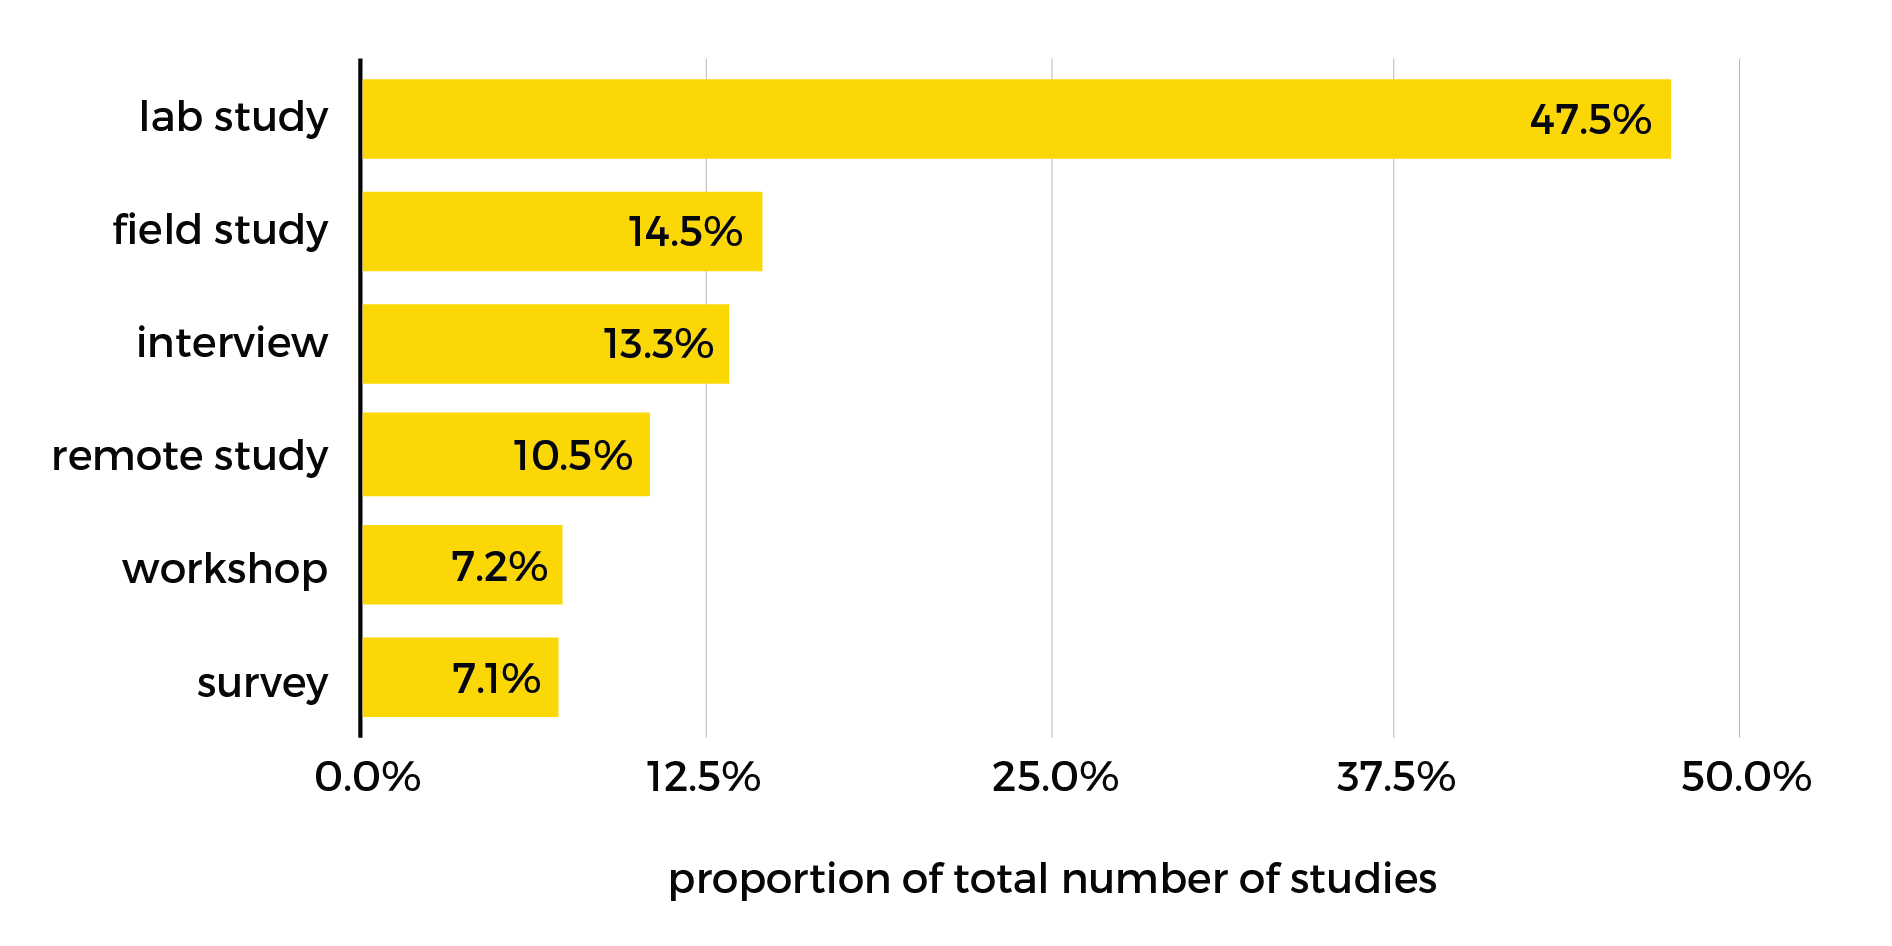
So in conclusion:
- Lab studies make up almost half of the studies presented in CHI2018 papers (personally, I had expected more diversity of methodologies, but the field’s lab-based research roots are clearly still quite dominant)
- In field studies, interviews, lab studies, and workshops the majority of studies have fewer than 20 participants
- In remote studies and surveys the majority of studies have more than 100 participants
- A total of 243,071 participants were involved in all of these studies (assuming there is no overlap in participants). The CHI2018 acceptance rate was 26%, so assuming the rejected papers had similar participant numbers there may have been close to a million participants involved in studies. Crazy.
Disclaimers:
- I used the following definitions for each methodology, imperfect but good enough for a rough classification:
- Field study – defined as a study outside the lab, in the ‘real world’. Anything from asking people to use an app for a few weeks to long-term ethnographical studies.
- Interview – defined as a study that is primarily informed by face-to-face or phone interviews
- Lab study – defined as a study that takes place in a controlled environment, often consisting of short sessions where participants carry out defined tasks in the presence of the researcher.
- Remote study – defined as a study carried out via some kind of online platform (for example Amazon Mechanical Turk), where participants are recruited to remotely carry out defined tasks.
- Survey – defined as a study that consists of participants filling out a questionnaire. Often these studies recruit participants via mailing lists, recruitment platforms like Prolific Academic, or social networks.
- Workshop – defined as a study where a group of co-located participants discuss/carry out tasks/brainstorm/create/etc.
- Methodology:
- I went through the CHI proceedings and looked for information about the numbers of participants, mainly by doing ctrl + f + ‘participant’ / ‘recruit’. This was done manually, as the structure of papers and notation of participants differs greatly. As a result it probably contains some errors. Not all papers are equally clear: I was unable to use descriptions like ‘research with 5 families’. Similarly, a description like ‘several workshops with a total of 60 participants’ does not indicate how many were used per workshop, so this will have skewed the data. Only studies in which participants were in some way recruited were included, e.g. not dataset analysis.
- If authors used a mixed methods approach the main methodology was used to classify the study (e.g. lab study with a demographic survey at the start and an interview at the end was described as a lab study). In some cases this was tricky to determine, so it likely contains some errors. It would be interesting to do a more nuanced classification to look at mixed methods approaches.
- If the authors mentioned removing participants from the sample the number of participants used for the study’s analysis was used instead. Some papers include more than one study, in which case the studies are included separately – unless they used the same participants.
- ‘Give me more numbers’ – alright (based on raw data, no outliers removed):
- Field studies: n=98, average=19.1, standard deviation=17.7, median=13
- Interview: n=90, average=19.2, standard deviation=10.8, median=17.5
- Lab study: n=322, average=23.4, standard deviation=22.3, median=16
- Remote study: n=71, average=2867.2, standard deviation=20040.4, median=129 (note: definitely contains big outliers!)
- Survey: n=48, average=500.6, standard deviation=1195.2, median=166.5 (note: definitely contains big outliers!)
- Workshop: n=49, average=19.1, standard deviation=17.7, median=13
- Last but not least: please remember that many participants != good study, few participants != bad study. There are different quantitative and qualitative approaches, and many other factors come into doing good research.