How do you assess whether a job matches what you are looking for? How do you get a sense of the day-to-day work, beyond what a job advert, organisation’s website, and interview panel may disclose? I’ve done dozens of hiring interviews – some from the perspective of a candidate – but I can’t say any of them have meaningfully conveyed what the role would be like. Deciding on a role is always a jump in the deep end.
Job searches are not just conduits that connect individuals to work […] They are interesting and important spaces in their own right where a great deal [of] learning occurs and where job seekers come to craft conceptions of work, of themselves, and of their chosen occupation in ways that direct how they engage with their work, how they evaluate corporations, and how they feel about themselves and their place in the field
Wullert, K. E. (2021). Learning on the Job Search: How Application Experiences Shape Labor Market Outcomes. Stanford University.
What might help someone evaluate whether a position is right for them?
Over the last few months, several separate conversations have culminated in the thought that a bit of calendar transparency may aid in providing some insight into the substance of a role. Specifically, I had conversations with:
- someone who is trying to decide whether to become a manager or whether to go down the individual contributor path
- job candidates who have asked what the balance of evaluative and generative research in the vacancy is
- Katalin Osz (IKEA), who is talking to Principal UX/Design Researchers across Europe about what this role entails
It seems to call for some show, don’t tell, so why not have a look at an average working week? Below is my personal calendar analysis of the week of 21 March 2022.
Evaluative vs generative research
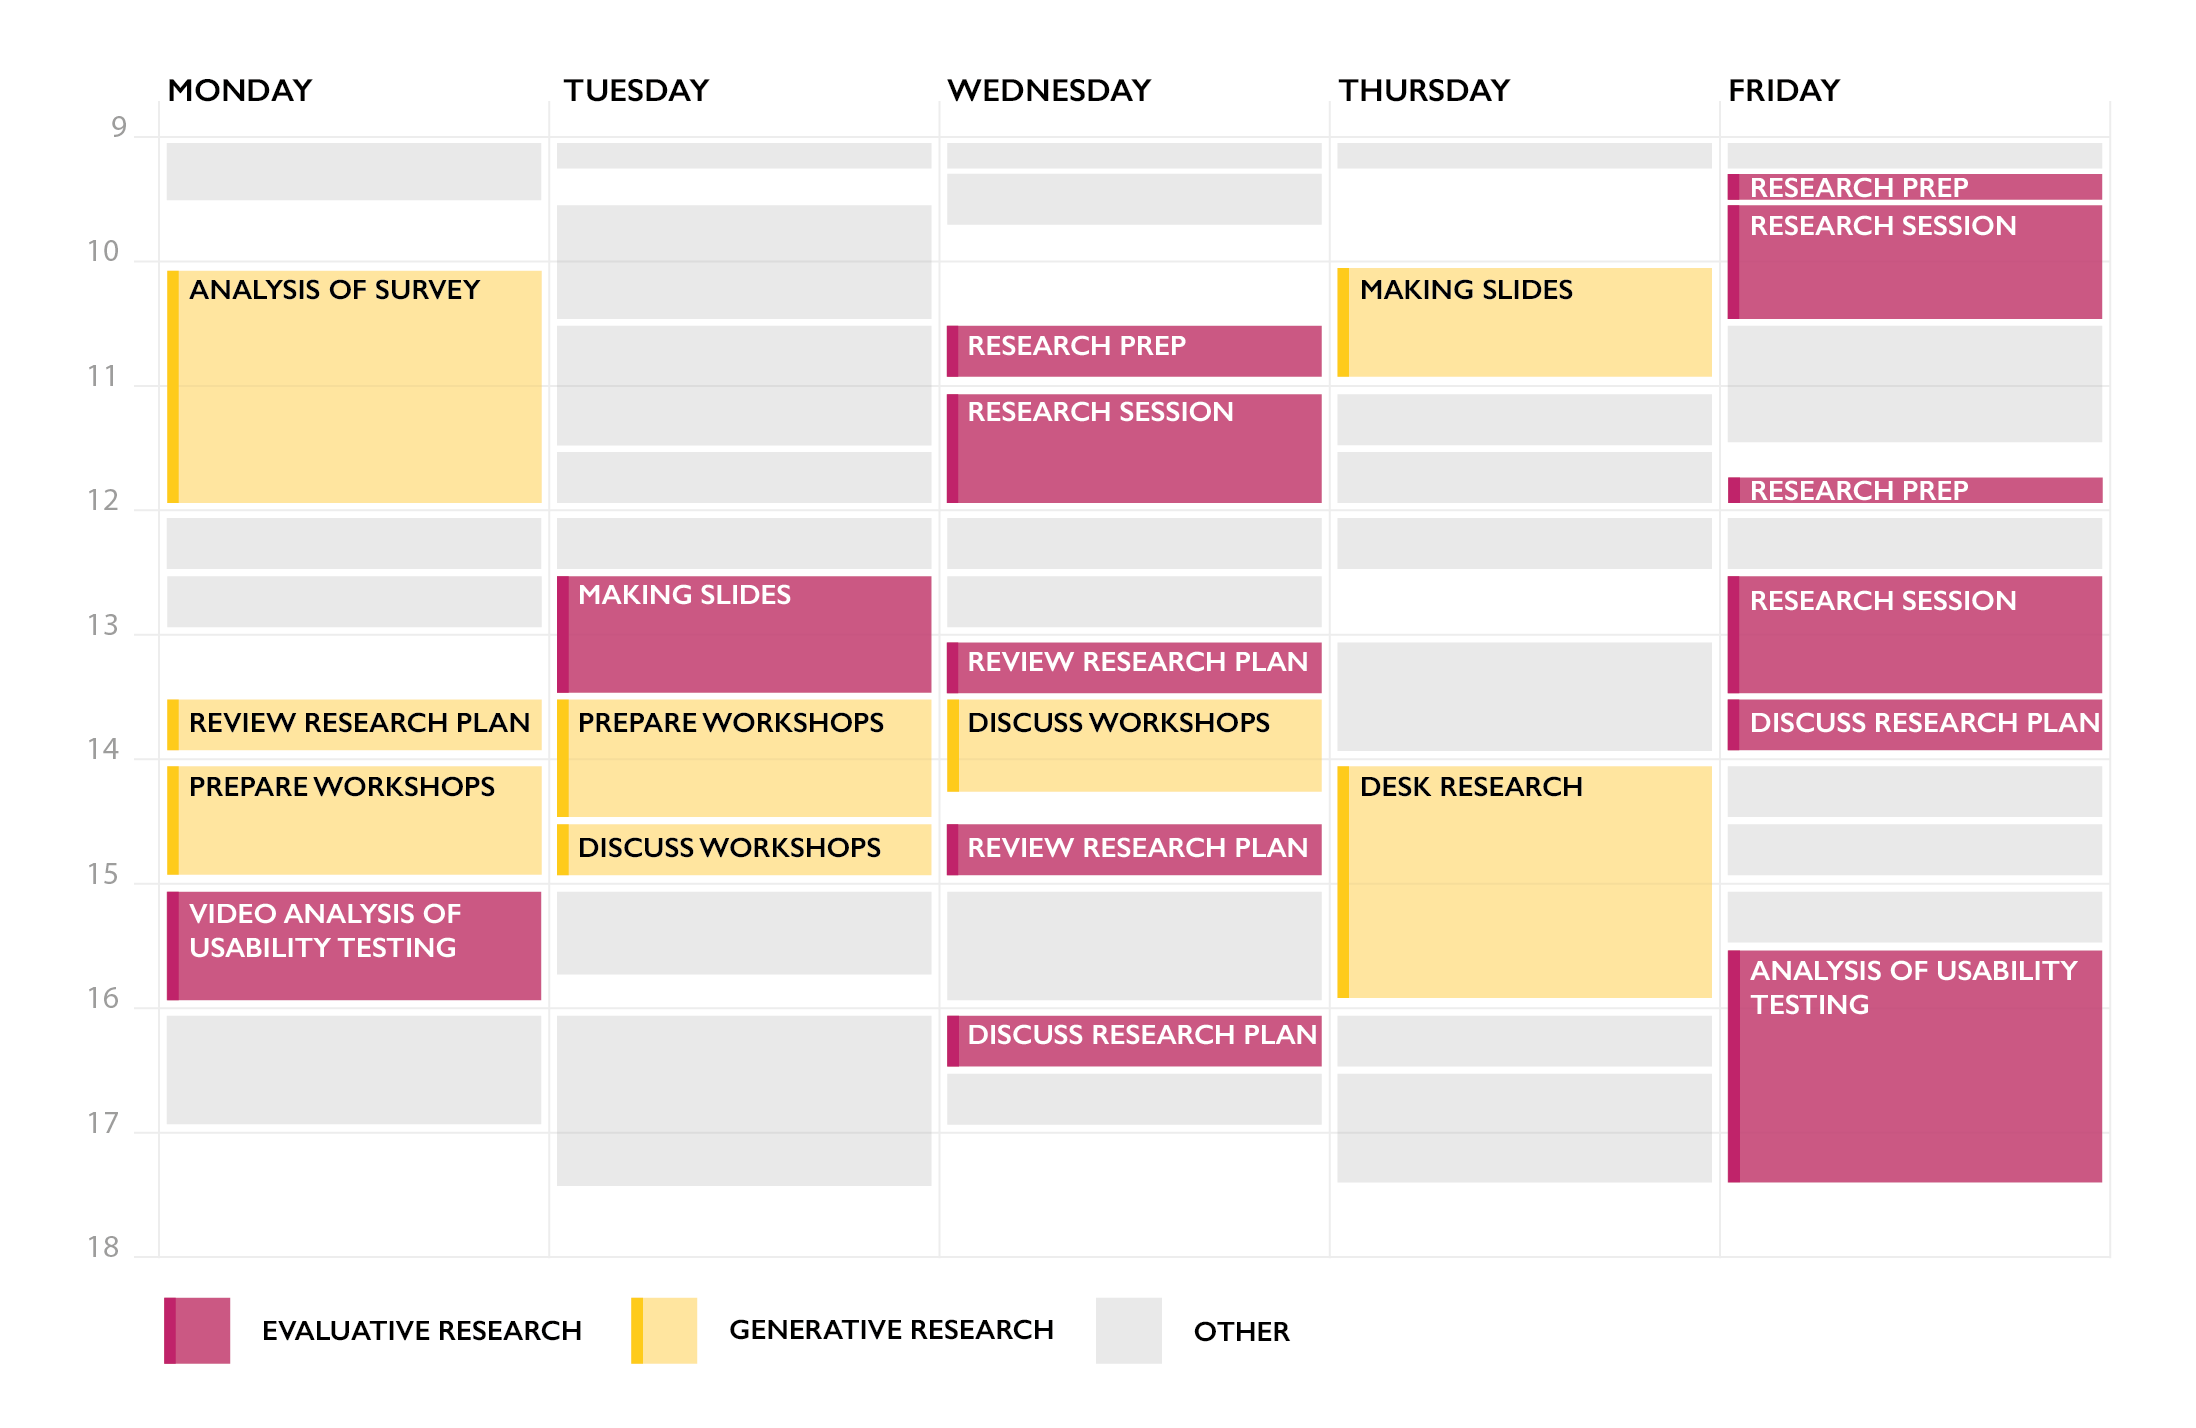
A question that job candidates often ask in UX research hiring interviews is about the types of research they may do in the role. The balance of evaluative and generative research reveals a lot about an organisation, it indirectly reveals bits and pieces about:
- whether the work you do will have impact, and if so how small or big that impact may be
- whether the organisation is bought into user-centred design — culturally, monetarily, etc.
- whether the organisation is looking beyond tactical work
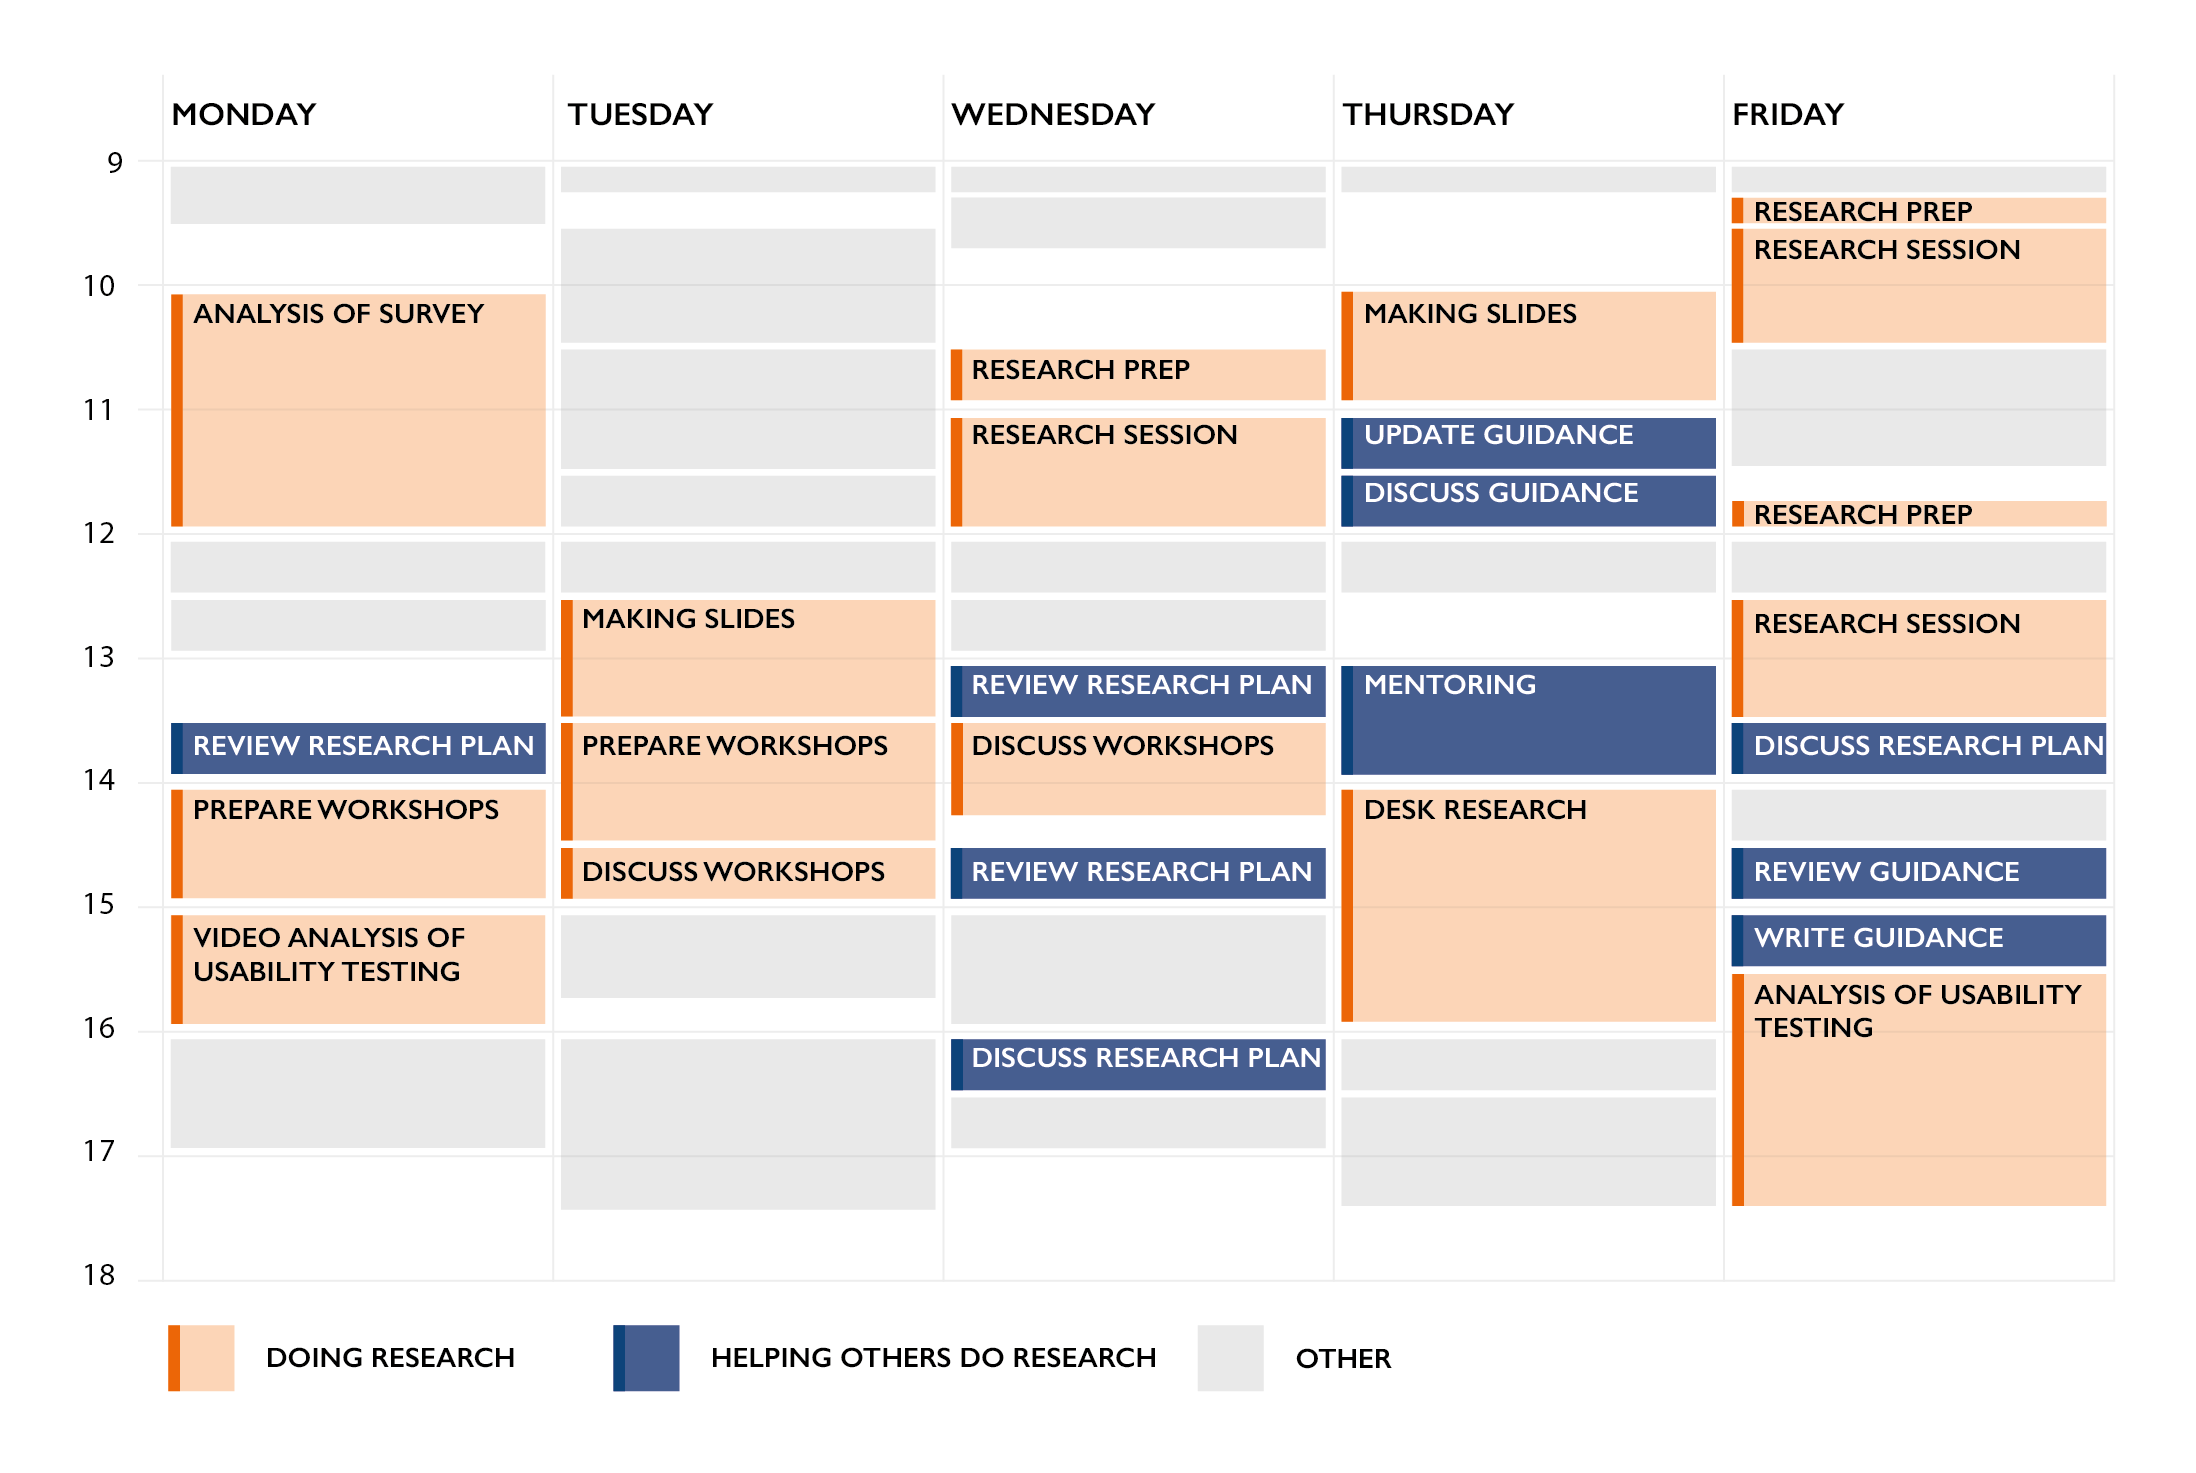
In the week of 21 March I spent 18 hours and 45 minutes on activities directly related to research:
| Activities related to a usability testing project | 8 hours |
| Reviewing other people’s evaluative research plans | 2 hours |
| Evaluative research | 10 hours (53%) |
| Activities related to planning generative workshop | 3 hours 15 min |
| Analysis of generative survey | 3 hours |
| Reviewing other people’s generative research plans | 0 hours 30 min |
| Desk research around a specific opportunity | 2 hours |
| Generative research | 8 hours 45 min (47%) |
While the precise division of work shifts week-by-week, the even split between evaluative and generative research feels indicative of my current role. I support a number of product teams as well as more strategic projects looking further into the 5-10 year future — which is accurately reflected in this split. Note that reality is not as clear cut as this overview makes it seem: many evaluative projects have a generative aspect too, and occasionally vice versa.
Meetings
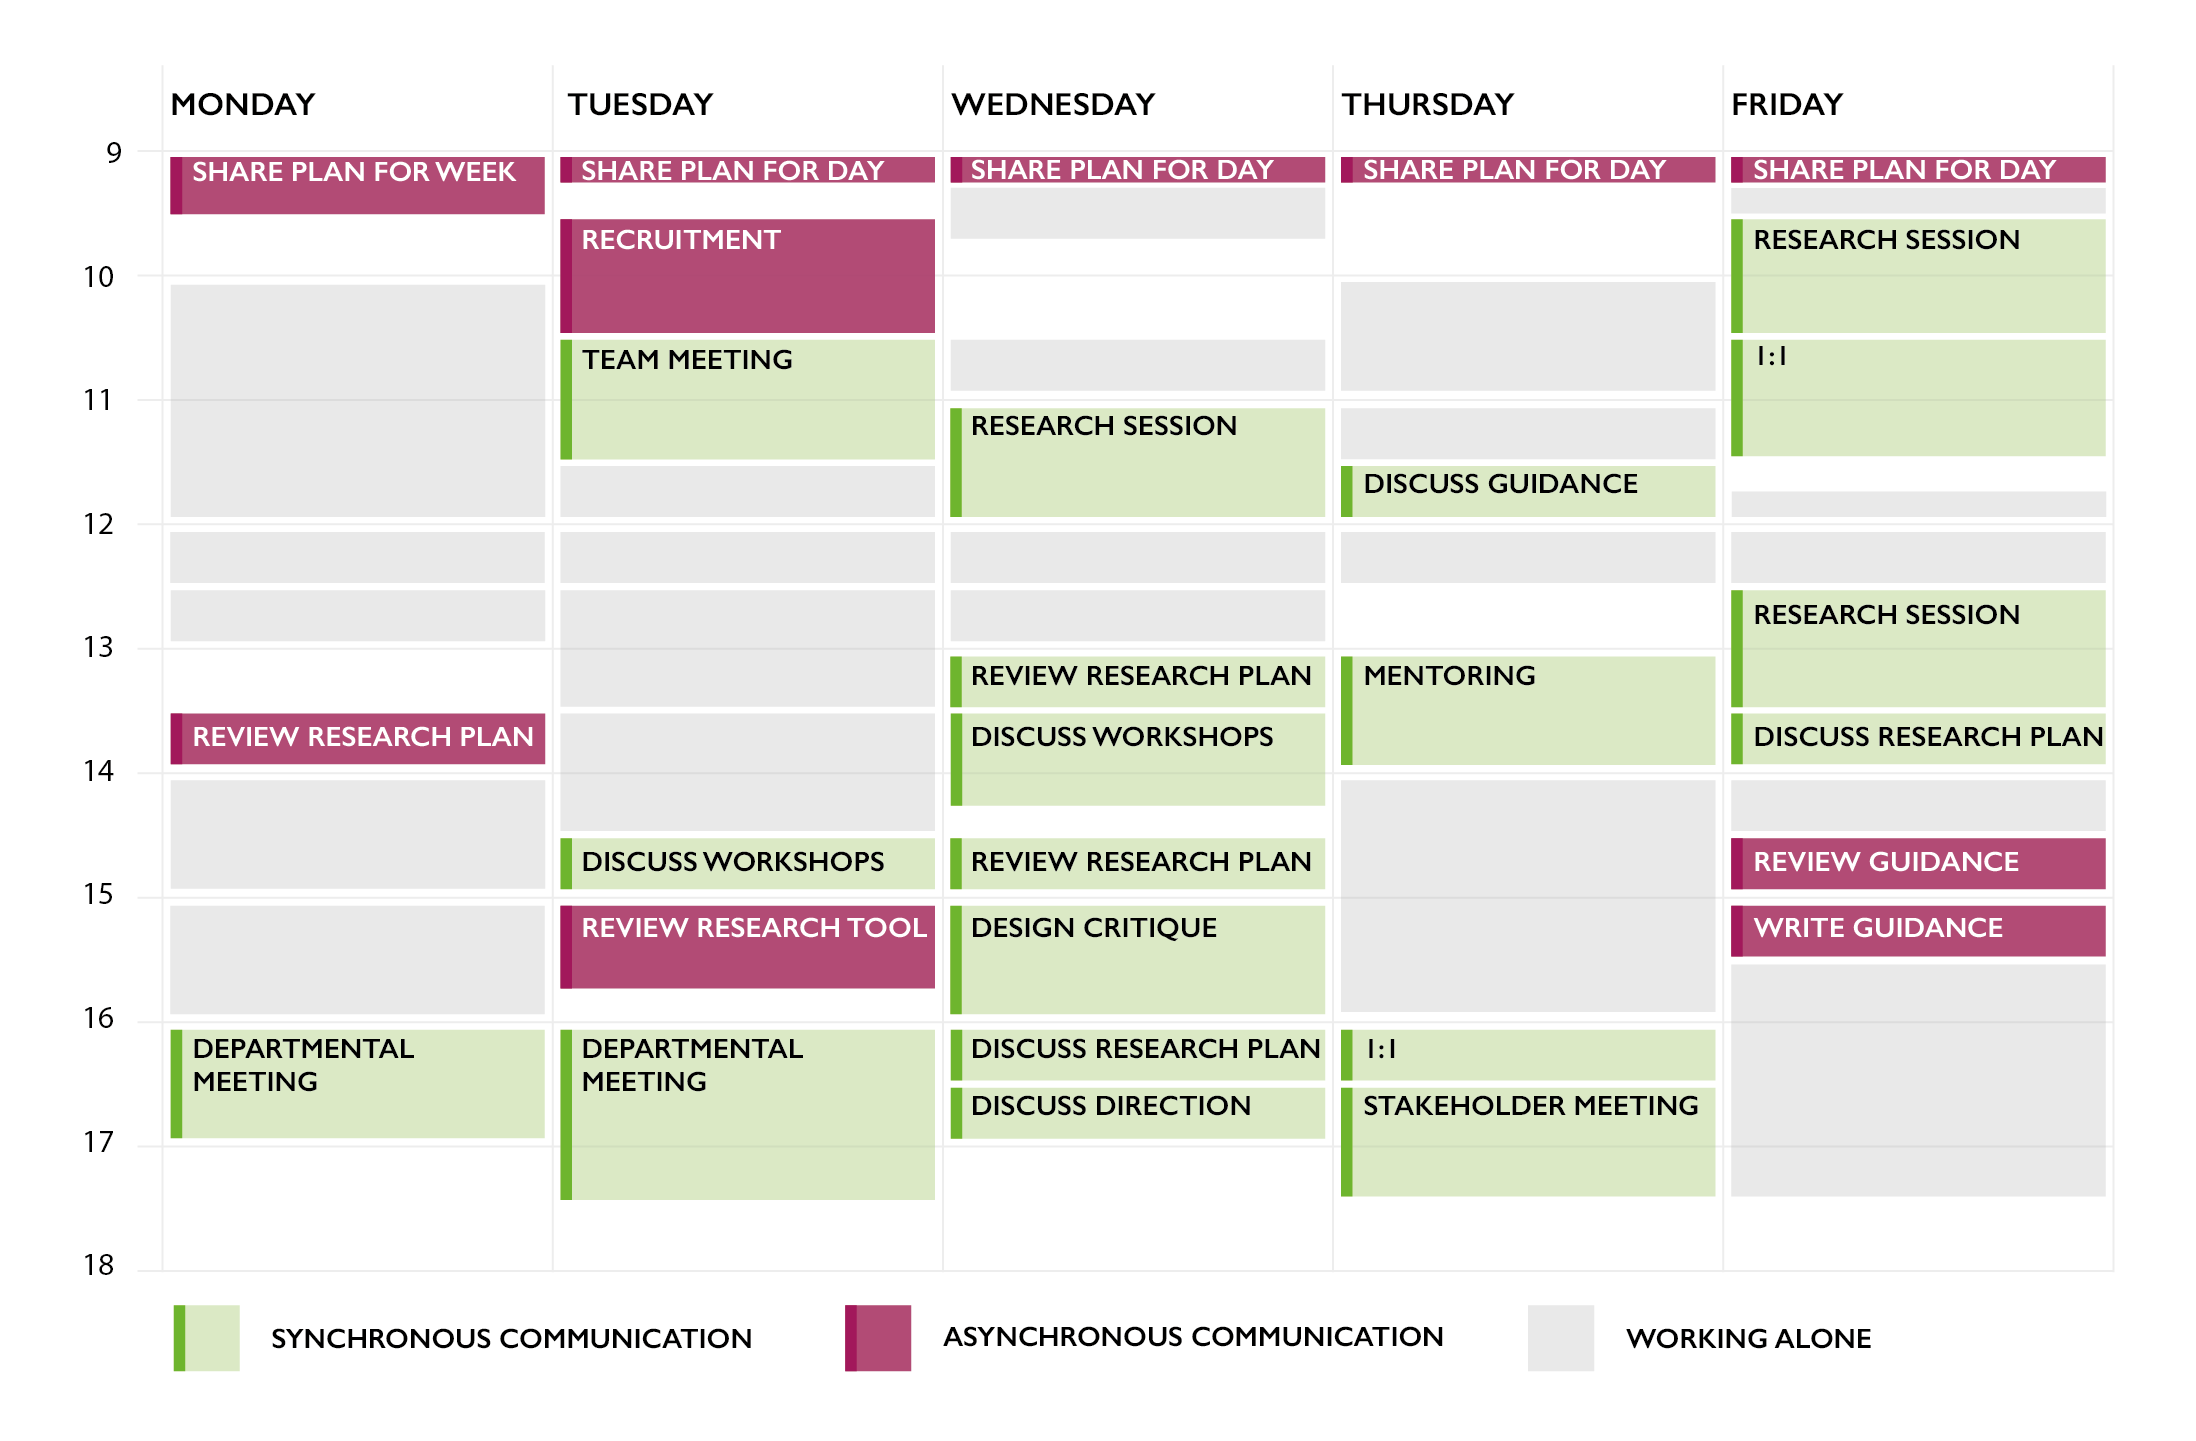
Meeting density is another potential indicator of what life at an organisation may be like:
- whether you will work in an embedded or centralised manner
- whether you will work collaboratively or independently
- whether you will have sufficient focus time for things like analysis
As I lived through it, my feeling was that this specific week was relatively light on meetings. I’d also argue that is what made it a productive week, as there was time to get work done independently as well as time to work and align with others.
In the analysis I’ve not included things that are not explicitly activities in my calendar, such as asynchronous communication via Slack and email. Had those been included, the calendar overview would’ve been littered with small bursts of asynchronous communication between and during activities.
| Synchronous communication | 15 hours 30 min (41%) |
| Asynchronous communication | 4 hours 45 min (13%) |
| Working alone | 17 hours 30 min (46%) |
| All scheduled activities | 37 hours 45 min |
Doing vs supporting
The balance of doing research compared to supporting others in doing research changes as you progress from junior to mid-weight to senior. Principal roles in particular come with expectations of coaching, thought leadership, or other equally uncomfortable descriptions I’d prefer to stick under the heading ‘helping others do research’.
Again, this information may reveal things about a role and organisation, such as:
- size of the team
- research maturity
- expectations of different roles (e.g. who within the organisation does research)
During this week I personally worked on 4 research projects, and advised on 5 projects done by others. In addition, I worked on guidance meant to help others do specific types of research, and I did some mentoring. The vast majority of time was spent “doing research” myself:
| Preparing research | 4 hours 15 min |
| Desk research | 2 hours |
| Research sessions | 3 hours |
| Analysis | 5 hours |
| Working on storytelling | 2 hours |
| Doing research | 16 hours 15 min (74%) |
| Mentoring | 1 hour |
| Working on research guidance | 2 hours |
| Reviewing research plans | 2 hours 30 min |
| Helping others do research | 5 hours 30 min (26%) |
ResearchOps
Finally a small note on research operations, the nuts and bolts of the work. Time spent on this may reveal:
- size of the UX org – operations is key when research is done at scale
- how seriously the organisation is about building knowledge
- if there are dedicated research operations people to support this work or not
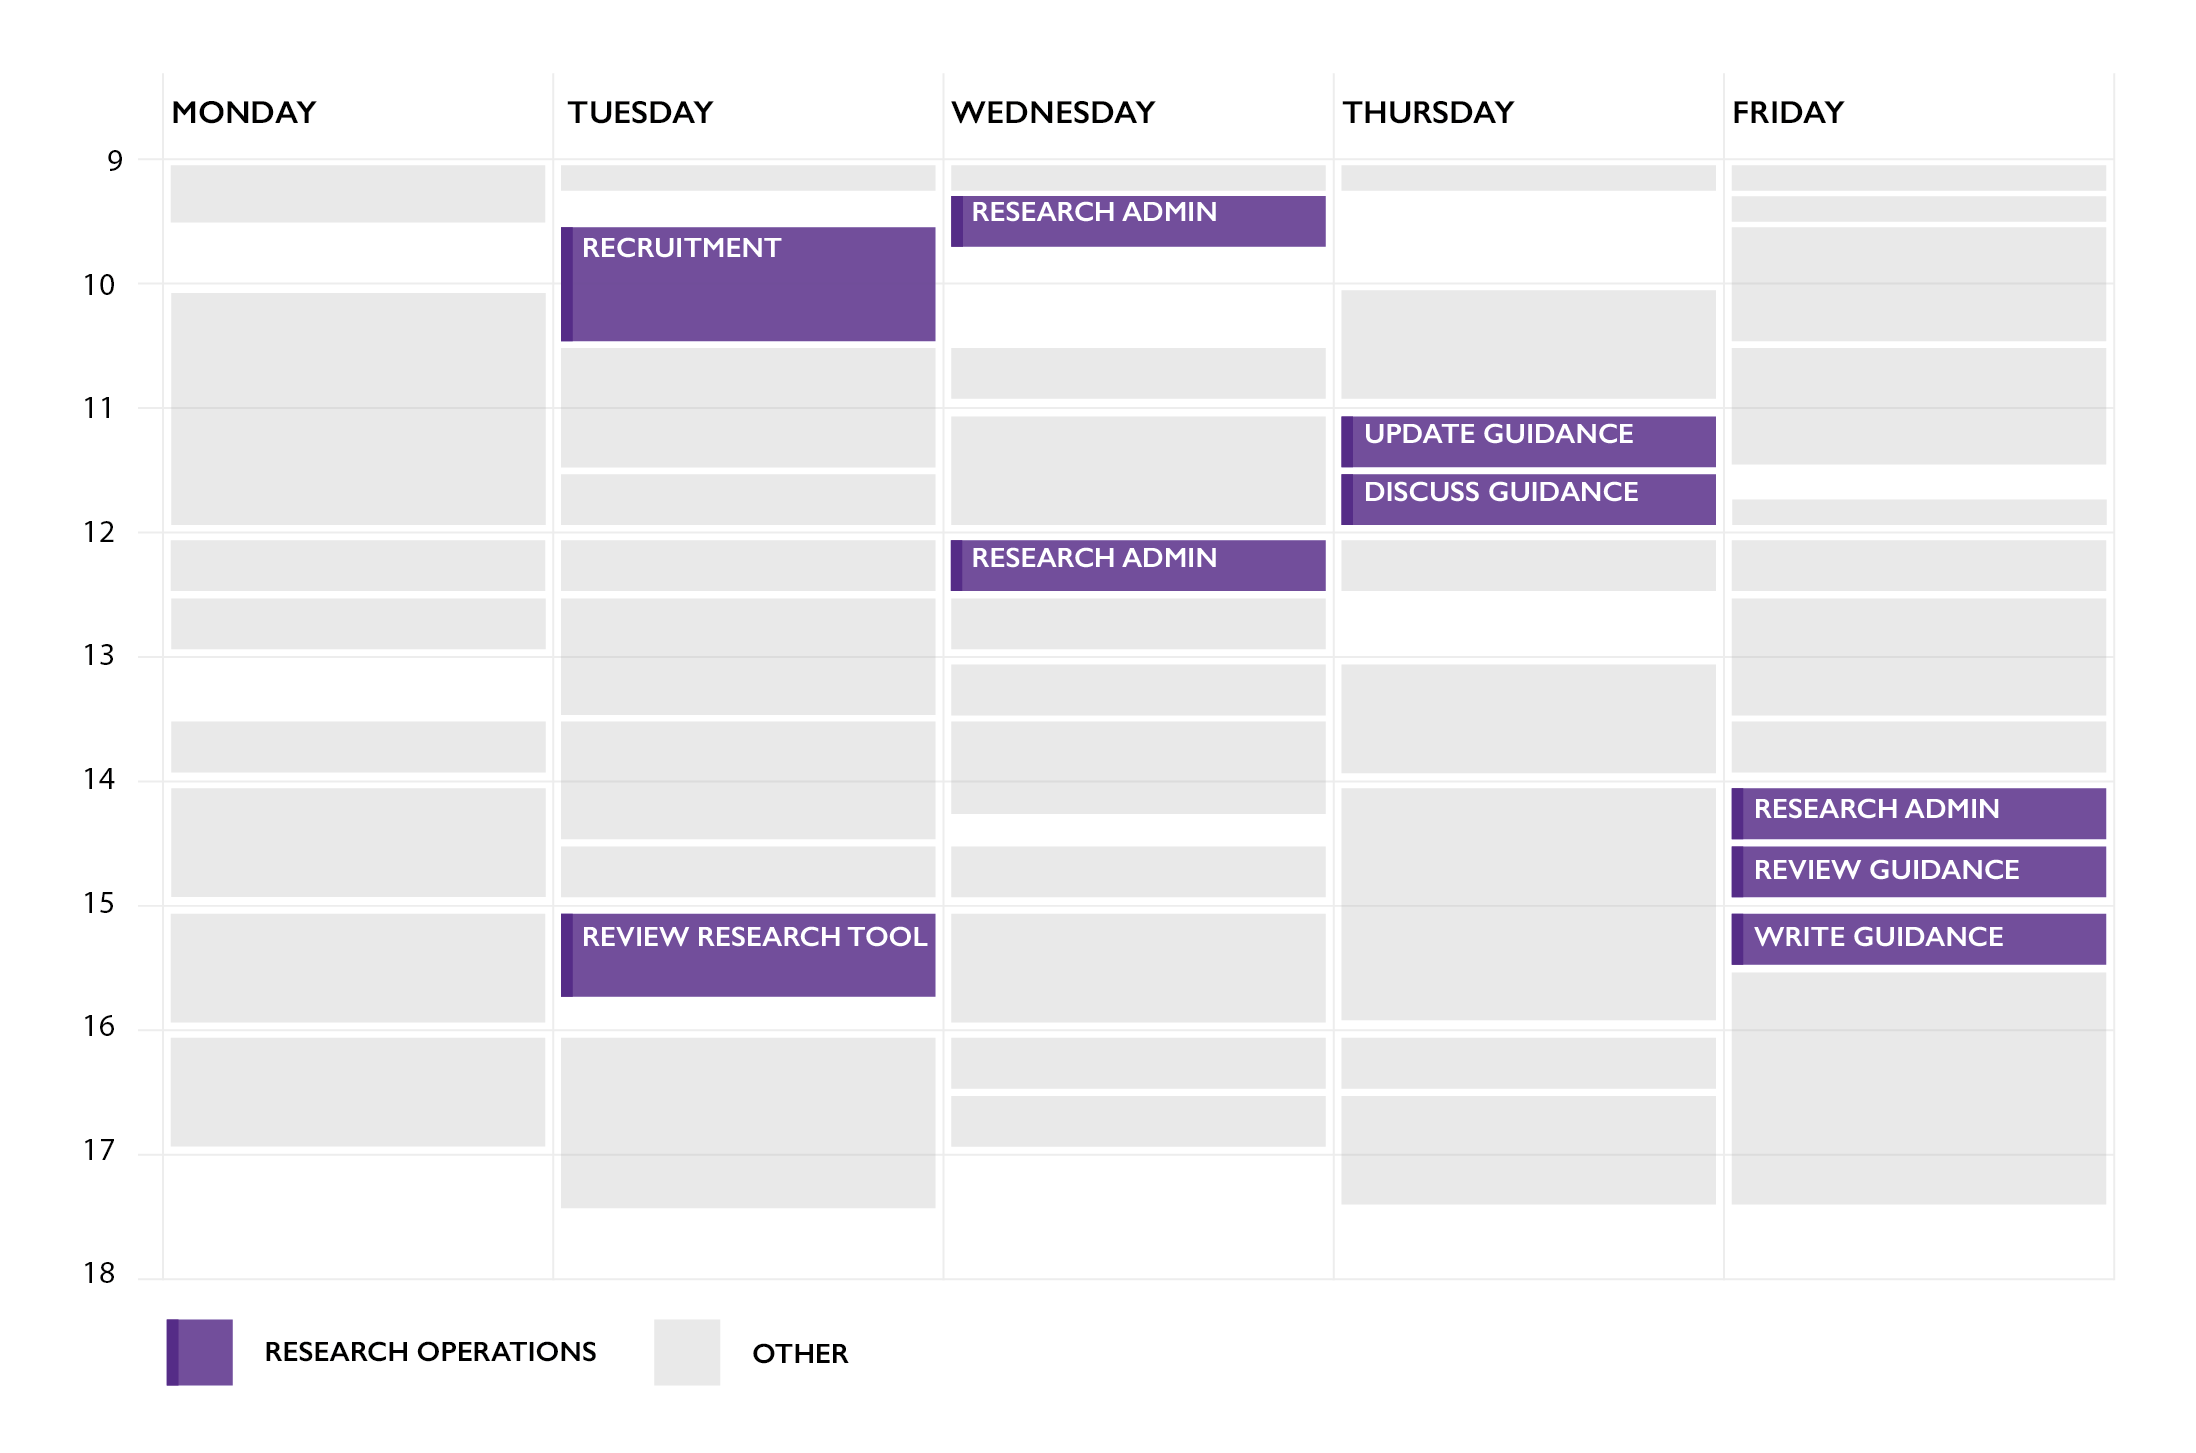
I spent a total of 5h and 15m on operations related activities throughout the week, around 1.5h on admin (GDPR compliance, putting files where they belong, updating research repository, etc.), 2h writing guidance, 45min reviewing a potential new tool for unmoderated research, and an hour on recruitment (defining profiles, some direct outreach).
Final notes
A few thoughts to wrap up:
- There are many ways to dissect a calendar week, many of which I have purposely not covered, including more subjective approaches (degree of productivity per activity, enjoyment per activity, etc.).
- Calendar analysis is a funny thing, it makes you question all extremes: did I have enough meetings? Was my week too fragmented?
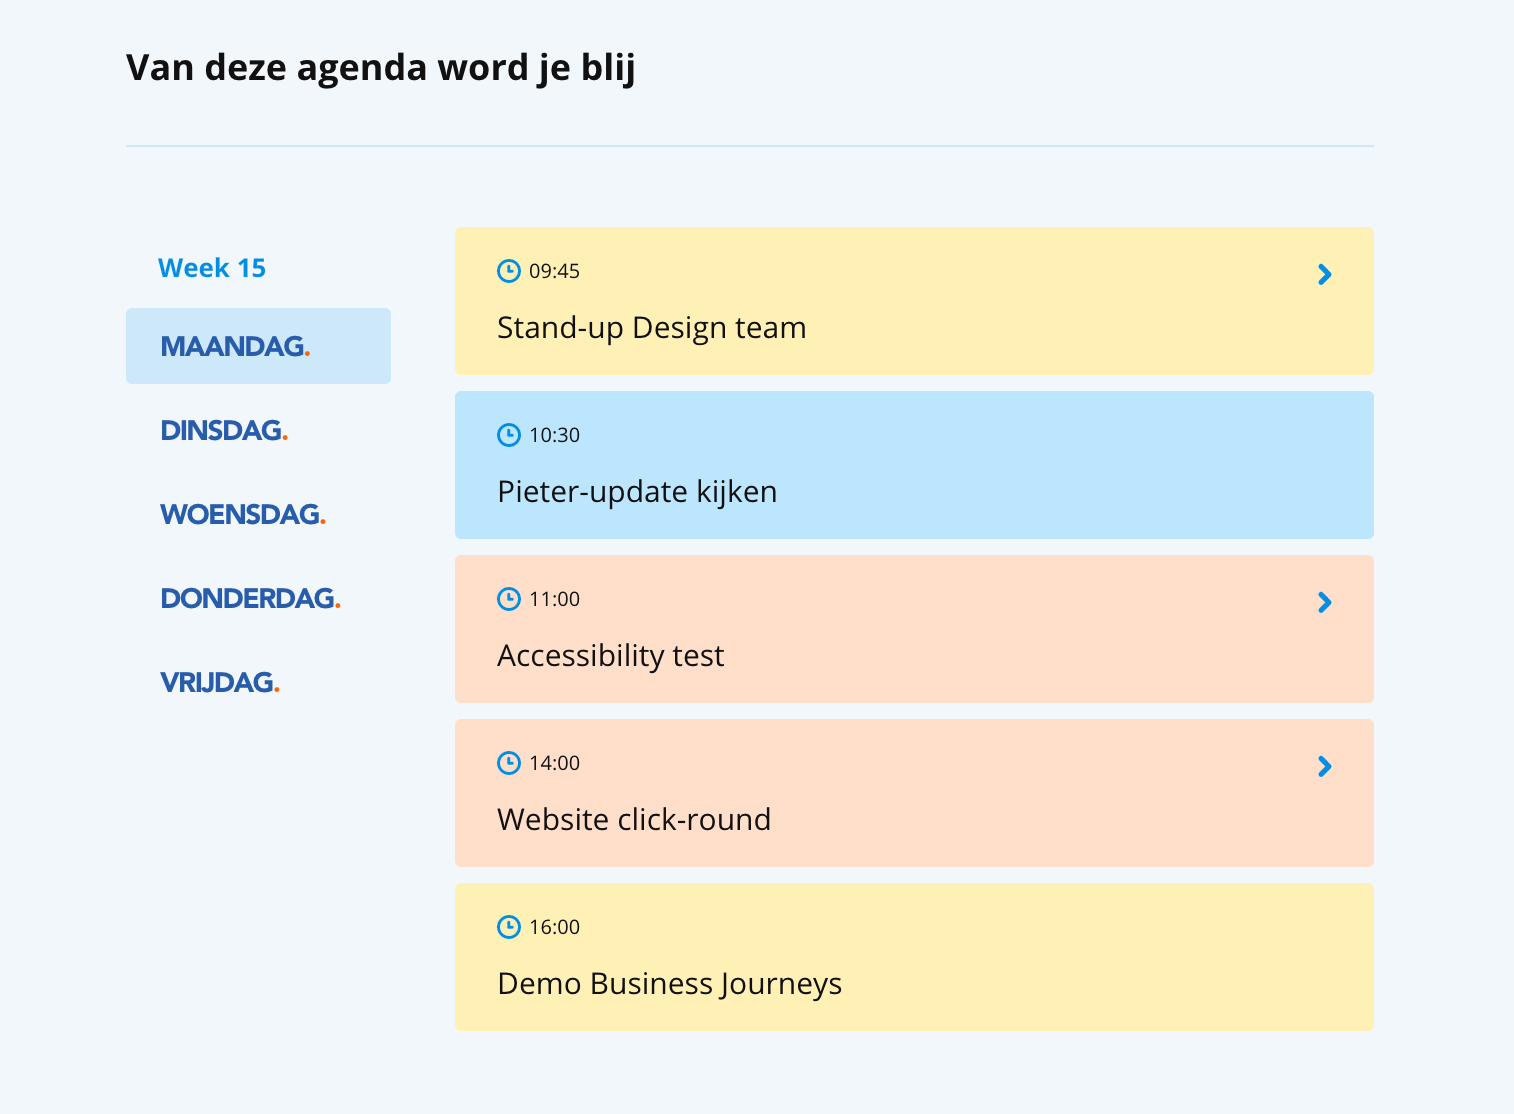
- As I was writing this, someone pointed out that some organisations actually include example calendar overviews in their job adverts. For example, Coolblue lets you browse through some weekdays under the heading ‘This calendar will make you happy’. Not sure if these are accurate reflections of reality, but they look reasonable enough – a very nice concept:
I hope this analysis provides some more insight into the substance of the Principal UX Researcher role. However, I have no idea how this division of time and tasks compares to people doing the same role at other organisations. Which nicely leads me to my final point: if anyone else has done or will do a similar analysis of their calendar, do share!
P.S. We’re looking for a new colleague, if you’re interested in a Senior UX Researcher role feel free to reach out!